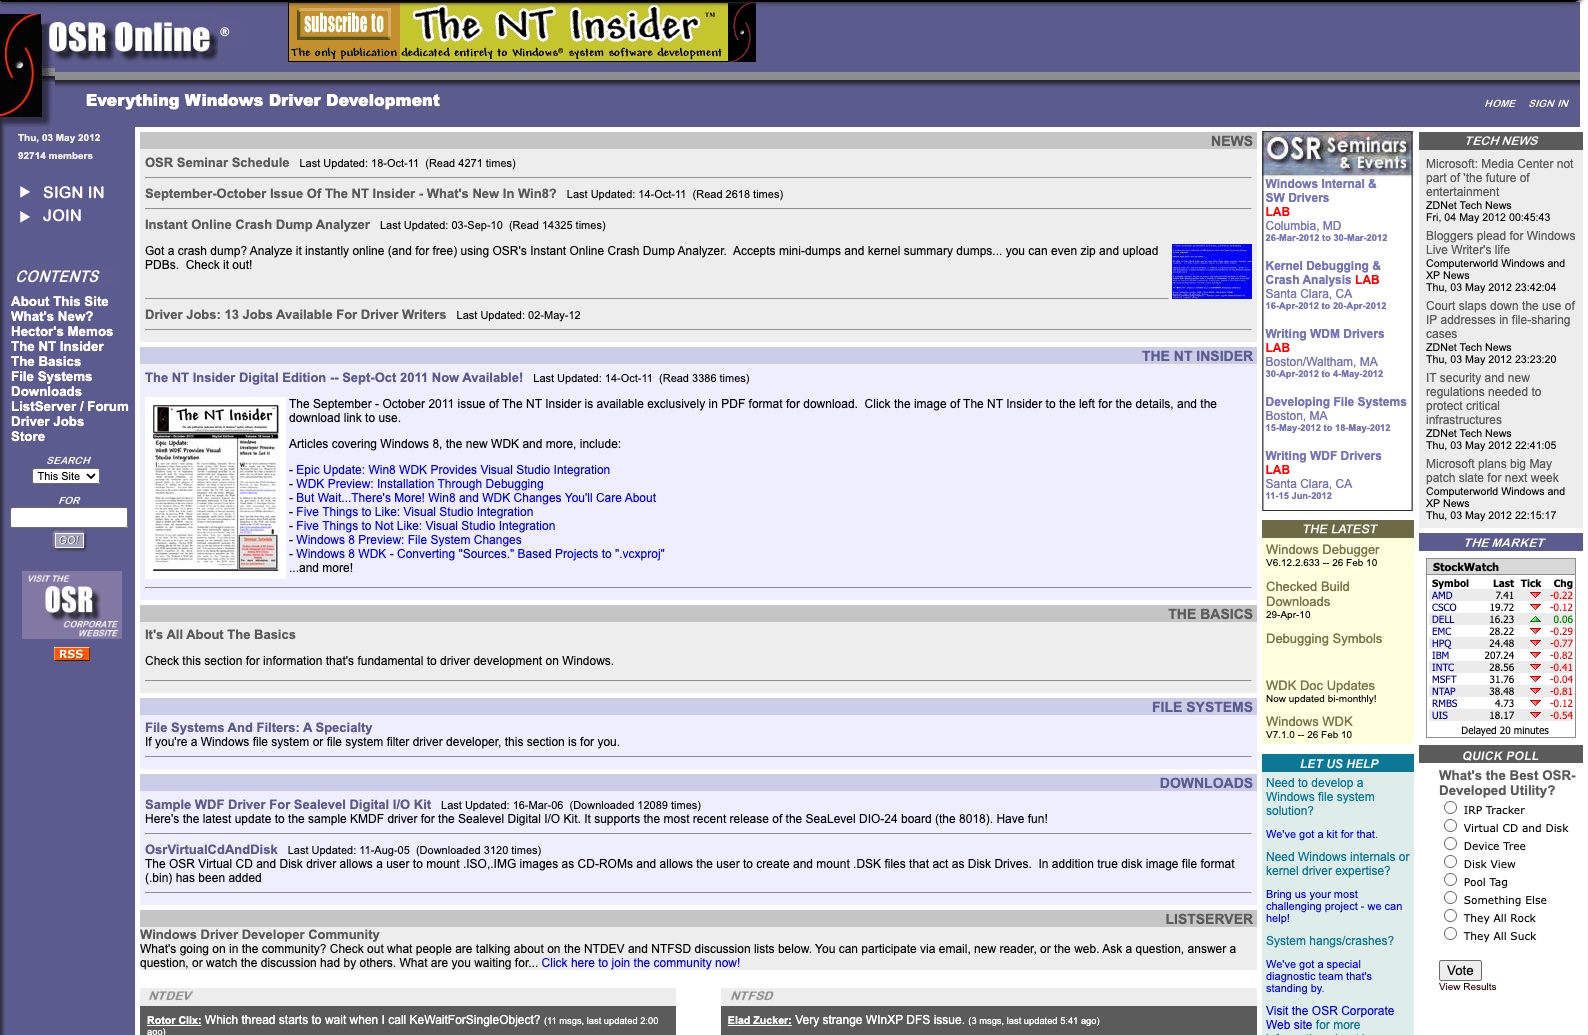
Previous Next

GFlags Examples

The examples in this topic show how to submit GFlags commands and how to use Gflags features in practical scenarios.

Example 1 – Displaying Global Flags

The commands demonstrated in this example display the system-wide flags set in the registry, the system flags set for the session (kernel mode), and the flags set for an image file.

The following GFlags command displays the current value of the system-wide flags set in the registry. It uses the /r parameter to specify the system-wide registry entry.

gflags /r 

In response, GFlags displays a single hexadecimal value representing the sum of all flags set and a list of the flags set.

Current Boot Registry Settings are: 40001400
    ptg - Enable pool tagging
    ust - Create user mode stack trace database
    bhd - Enable bad handles detection

In this example, the results show that there are three tags set, with a combined value of 0x40001400.

The following command displays the flags set for the current session. It uses the /k parameter to indicate kernel mode.

gflags /k 

The following command displays flags set in the registry for the image file Notepad.exe. It uses the /i parameter to indicate image file mode and specifies the image file.

gflags /i notepad.exe 

Remember that the flag value displayed might not be the current, effective flag value. Changes to the system-wide flags are not effective until you restart Windows. Changes to image file flag settings are not effective until you restart the program.

Example 2 – Setting a Flag by Using a Flag Abbreviation

The following command sets the Show Loader Snaps flag for the Notepad.exe image file. Show Loader Snaps takes snapshots of the load process, capturing in detail the loading and unloading of executable images and their supporting library modules.

The command uses the /i parameter to indicate image file mode and specifies the name of the image file Notepad.exe. To identify the flag, the command uses sls, the abbreviation for Show Loader Snaps, and it precedes the abbreviation with a plus sign (+) to indicate that the flag is set. Without the plus sign, the command has no effect.

gflags /i notepad.exe +sls 

In response, GFlags displays the flags set for Notepad.exe. The display indicates that the command is successful. The Show Loader Snaps feature is enabled for all new sessions of the Notepad program.

Current Registry Settings for notepad.exe executable are: 00000002
    sls - Show Loader Snaps

Example 3 – Setting a Flag by Using Its Hexadecimal Value

The following command sets the system-wide Enable Page Heap flag. Enable Page Heap adds a guard page and other tracking features to each heap allocation.

The command uses the /r parameter to indicate system-wide registry mode. To identify the flag, the command uses 2000000, which represents 0x2000000, the hexadecimal value for Enable Page Heap.

Although the command sets a flag, it omits the plus (+) sign. When using hexadecimal values, the sign is optional and add (+) is the default.

gflags /r 2000000 

In response, GFlags displays the system-wide flags set in the registry. The display indicates that the command is successful. The Enable Page Heap feature will be enabled for all processes when Windows restarts.

Current Boot Registry Settings are: 02000000
    hpa - Enable page heap

Example 4 – Setting Multiple Flags

The following command sets these three flags for the current session:

This command uses the /k parameter to specify kernel mode (session only). It sets the value for kernel mode to E0 (0xE0), the sum of the hexadecimal values of the selected flags (0x20 + 0x40 + 0x80).

gflags /k e0 

In response, GFlags displays the revised value of flags set for the session. The display indicates that the command is successful and that the three flags specified in the command are set.

Current Running Kernel Settings are: 000000e0
    hfc - Enable heap free checking
    hpc - Enable heap parameter checking
    hvc - Enable heap validation on call

You can use several different GFlags commands to set flags. Each of the following commands has the same effect as the command used in this example and the methods can be used interchangeably:

gflags /k +20 +40 +80 
gflags /k +E0 
gflags /k +hfc +hpc +hvc 

Kernel-mode (session-only) flags are effective immediately and remain effective until Windows shuts down.

Example 5 – Clearing a Flag

The following command clears the system-wide Enable Page Heap flag set in the registry. The command uses the /r parameter to indicate the system-wide registry mode and hpa, the abbreviation for the Enable Page Heap flag. The minus sign (-) indicates that the flag is to be cleared.

gflags /r -hpa 

In response, GFlags displays the current value of the system-wide registry entry. The display indicates that the command is successful and that there are no longer any flags set.

Current Boot Registry Settings are: 00000000 

Note that the following command, which uses the hexadecimal value of the Enable Page Heap flag, has the same effect as the command used in this example. These commands can be used interchangeably:

gflags /r -02000000 

Example 6 – Clearing All Flags

This example demonstrates two different ways to clear all flags set in the registry and for the session:

Note  The methods demonstrated by this example clear flags only. They do not reset the maximum stack trace size or kernel special pool tag to the default values.

Subtract the Current Flag Value

The following command clears all flags set in the system-wide flag entry in the registry by subtracting the current value of the entry. In this example, the current value is 0xE0. The command uses the /r parameter to indicate the system-wide registry mode and the E0 value with a minus sign (-) to subtract E0 from the flag value.

gflags /r -E0 

In response, GFlags displays the revised value of system-wide flag registry entry. A value of zero indicates that the command is successful and that there are no longer any system-wide flags set in the registry.

Current Boot Registry Settings are: 00000000 

Note that the following commands have the same effect as the command used in this example and can be used interchangeably:

gflags /r -20 -40 -80 
gflags /r -hfc -hpc -hvc 

Subtract High Values

The following command clears all system-wide flags by subtracting high values (0xFFFFFFFF) from the system-wide flag setting.

gflags /r -ffffffff 

In response, GFlags displays the revised value of the system-wide flag entry. A value of zero indicates that the command is successful and that there are no longer any system-wide flags set in the registry.

Current Boot Registry Settings are: 00000000 

Tip  Type this command into Notepad, then save the file as ClearFlag.bat. Thereafter, to clear all flags, just type ClearFlag.

Finally, the following example demonstrates that the intuitive method of clearing all flags does not work.

The following command appears to set the value of the system-wide flag entry to 0. However, it actually adds zero to the system-wide flag value. In this example, the current value of the system-wide flag entry is 0xE0.

gflags /r 0 

In response, GFlags displays the system-wide flag value after the command completes:

Current Boot Registry Settings are: 000000e0
    hfc - Enable heap free checking
    hpc - Enable heap parameter checking
    hvc - Enable heap validation on call

The command has no effect because it adds the value 0 to system-wide flag entry.

Example 7 – Clearing All Flags for an Image File

The following command clears all flags and image debugger options for an image file. The command adds high-values (0xFFFFFFFF) to the current flag value. GFlags responds by deleting the GlobalFlag registry entry for the image file, thereby deleting all of the values it stores.

This command does not affect flags set in the system-wide GlobalFlag registry entry or flags set for the session (kernel mode).

gflags /i notepad.exe ffffffff 

In response, GFlags displays a message indicating that there are no flags set for the image file:

No Registry Settings for notepad.exe executable 

Example 8 – Enlarging the User-Mode Stack Trace Database

The following GFlags command increases the maximum size of the user-mode stack trace database for MyApp.exe, a fictitious program, from 8 MB to 24 MB.

The command uses the /i parameter to specify the image file. It uses the /tracedb parameter to set the maximum stack trace database size and the value 24 to indicate the size in megabytes. The command uses decimal units. (Hexadecimal units are not valid.)

gflags /i MyApp.exe /tracedb 24

As the following error message indicates, this command fails because the Create user mode stack trace database (+ust) flag is not set for the MyApp image file. You cannot set the size of a trace database until you create one.

Failed to set the trace database size for `MyApp.exe'

The following commands fix the error. The first command creates a trace database for MyApp.exe and the second command sets the maximum size of the trace database to 24 MB. These commands cannot be combined into a single command. The following display shows the commands and the success message from GFlags.

gflags /i MyApp.exe +ust

Current Registry Settings for MyApp.exe executable are: 00001000
    ust - Create user mode stack trace database

gflags /i MyApp.exe /tracedb 24

Trace database size for `MyApp.exe' set to 24 Mb.

GFlags can change the size of the user-mode stack trace database, but it does not display it. To display the trace database size, use registry APIs, Regedit, or Reg (reg.exe), a tool included in Windows XP and Windows Server 2003, to check the value of the StackTraceDatabaseSizeInMB registry entry (HKLM\Software\Microsoft\Windows NT\CurrentVersion\Image File Execution Options\ImageFileName\StackTraceDatabaseSizeInMB).

(A version of Reg is included in Windows XP, but that version does not permit the /v and /s switches in the same command.)

The following command uses Reg to query the value of StackTraceDatabaseSizeInMB:

reg query "HKLM\Software\Microsoft\Windows NT\CurrentVersion\Image File Execution Options\MyApp.exe" /v StackTraceDatabaseSizeInMB 

In response, Reg displays the value of StackTraceDatabaseSizeInMB, which confirms that the new value, 24 (0x18), was set. This value becomes effective when you restart MyApp.exe.

! REG.EXE VERSION 3.0

HKEY_LOCAL_MACHINE\Software\Microsoft\Windows NT\CurrentVersion\Image File Execution Options\MyApp.exe
    StackTraceDatabaseSizeInMB  REG_DWORD       0x18

Tip  Type the reg query command into Notepad, then save the file as TraceDb.bat. Thereafter, to display the value of StackTraceDatabaseSizeInMB, just type TraceDb.

Example 9 – Detecting a Pool Memory Leak

The following example uses GFlags to set the system-wide Enable pool tagging flag in the registry. Then, it uses Poolmon, a tool in the Windows DDK, to display the size of the memory pools.

Poolmon monitors the bytes in the paged and nonpaged memory pools and sorts them by pool tag. By running Poolmon periodically, you can identify pools that expand continuously over time. This pattern often indicates a memory leak.

Notes  Pool tagging is permanently enabled on all versions of Windows Server 2003. On these systems, the Enable pool tagging checkbox on the Global Flags dialog box is dimmed, and commands to enable or disable pool tagging fail.

If pool tagging is not enabled, Poolmon fails and displays the following message: "Query pooltags Failed c0000002."

To detect a pool memory leak

  1. To enable pool tagging for all processes, set the system-wide Enable pool tagging flag in the registry. The following command line uses the flag abbreviation method, but you can identify the flag by its hexadecimal value or use the Global Flags dialog box:
    gflags /r +ptg 
    
  2. Restart the computer to make the registry change effective.
  3. Run Poolmon periodically by using the following command. In this command, the /b parameter sorts the pools in descending size order.
    poolmon /b 
    

    In response, Poolmon displays allocations from the memory pools in descending size order , including the number of allocate operations and free operations, and the amount of memory remaining in the pool (in the Bytes column).

    Memory: 16224K Avail: 4564K PageFlts: 31 InRam Krnl: 684K P: 680K
     Commit: 24140K Limit: 24952K Peak: 24932K  Pool N: 744K P: 2180K
    
     Tag  Type    Allocs          Frees         Diff   Bytes      Per Alloc
    -----------------------------------------------------------------------
    
     CM   Paged    1283 (   0)    1002 (   0)    281 1377312 (     0) 4901
    Strg  Paged   10385 (  10)    6658 (   4)   3727  317952 (   512)   85
     Fat  Paged    6662 (   8)    4971 (   6)   1691  174560 (   128)  103
    MmSt  Paged     614 (   0)     441 (   0)    173   83456 (     0)  482
    

    If the value in the Bytes column for an allocation expands continuously for no obvious reason, there might be a memory leak in that pool.

  4. Clear the Enable pool tagging flag.

    The following command line uses the flag abbreviation method, but you can identify the flag by its hexadecimal value or use the Global Flags dialog box:

    gflags /r -ptg 
    
  5. Restart Windows to make the registry change effective.

Note  Use the append symbol (>>) to redirect the Poolmon output to a log file. Later, you can examine the log file for pool size trends. For example:

poolmon.exe /b >> poolmon.log 

Example 10 – Detecting a Heap Memory Leak in a Process

This example uses GFlags and User Mode Dump Heap (UMDH, umdh.exe), a tool included in Microsoft Debugging Tools for Windows. For information about UMDH, see the Debugging Tools Web site.

To detect a leak in heap memory in Notepad.exe

  1. Set the Create user mode stack trace database (ust) flag for the Notepad.exe image file.

    The following command uses GFlags to set the Create user mode stack trace database flag. It uses the /i parameter to identify the image file and the ust abbreviation for the flag.

    gflags /i Notepad.exe +ust 
    

    As a result of this command, a user-mode stack trace is created for all new instances of the Notepad process.

  2. Set the symbol file path.

    The following command creates an environment variable that stores the path to the directory of symbol files:

    set _NT_SYMBOL_PATH=C:\Windows\symbols
    
  3. Start Notepad.
  4. Find the process identifier (PID) of the Notepad process.

    You can find the PID of any running process from Task Manager or Tasklist (tasklist.exe), a tool included in Windows XP Professional and Windows Server 2003 operating systems. In this example, the Notepad PID is 1228.

  5. Run UMDH.

    The following command runs UMDH (umdh.exe). It uses the -p: parameter to specify the PID that, in this example, is 1228. It uses the /f: parameter to specify the name and location of the output file for the heap dump, Notepad.dmp.

    umdh -p:1228 -f:notepad.dmp 
    

    In response, UMDH writes a complete dump of all active heaps to the Notepad.dmp file.

Example 11 – Enabling Page Heap Verification

The following commands enable full and standard page heap verification for MyApp.exe, a fictitious program.

The first command enables standard page heap verification for MyApp.exe. It uses the /p parameter to enable page heap for a process. By default, /p enables standard page heap.

gflags /p /enable myapp.exe 

The following commands enable full page heap verification for the MyApp.exe program. Although these commands create different settings in the registry, they are all functionally equivalent to selecting the Enable page heap check box for the MyApp.exe image file in the Global Flags dialog box. These methods can be used interchangeably.

gflags /p /enable myapp.exe /full
gflags /i myapp.exe +hpa
gflags /i myapp.exe +02000000

The following commands disable full or standard page heap verification for the Myapp.exe program, regardless of the command or dialog box method used to enable page heap verification.

gflags /p /disable myapp.exe
gflags /i myapp.exe -hpa
gflags /i myapp.exe -02000000

Note  When using the /debug or /kdebug parameters, use the /p /disable parameters to turn off the page heap verification (not the /i -hpa parameters). The /p /disable parameters disable page heap verification and delete registry entries that the debugger reads.

Example 12 – Using Page Heap Verification to Find a Bug

The following series of commands demonstrates how to use the page heap verification features of GFlags and the Windowsฎ NTฎ Symbolic Debugger (NTSD) to detect an error in heap memory use. In this example, the programmer suspects that a fictitious application, Pheap-buggy.exe, has a heap error, and proceeds through a series of tests to identify the error.

For details on NTSD, see Debugging Tools for NT-Based Operating Systems.

Step 1: Enable standard page heap verification

The following command enables standard page heap verification for Pheap-buggy.exe:

gflags /p /enable pheap-buggy.exe

Step 2: Verify that page heap is enabled

The following command lists the image files for which page heap verification is enabled:

gflags /p

In response, GFlags displays the following list of programs. In this display, traces indicates standard page heap verification, and full traces indicates full page heap verification. In this case, Pheap-buggy.exe is listed with traces, indicating that standard page heap verification is enabled, as intended.

pheap-buggy.exe: page heap enabled with flags (traces )

Step 3: Run the debugger

The following command runs the CorruptAfterEnd function of Pheap-buggy.exe in NTSD with the -g (ignore initial breakpoint) and -x (set second-chance break on access violation exceptions) parameters:

ntsd -g -x pheap-buggy /CorruptAfterEnd

When the application fails, NTSD generates the following display, which indicates that it detected an error in Pheap-buggy.exe:

===========================================================
VERIFIER STOP 00000008: pid 0xAA0: corrupted suffix pattern

        00C81000 : Heap handle 
        00D81EB0 : Heap block 
        00000100 : Block size 
        00000000 :
===========================================================

Break instruction exception - code 80000003 (first chance)
eax=00000000 ebx=00d81eb0 ecx=77f7e257 edx=0006fa18 esi=00000008 edi=00c81000
eip=77f7e098 esp=0006fc48 ebp=0006fc5c iopl=0         nv up ei pl zr na po nc
cs=001b  ss=0023  ds=0023  es=0023  fs=0038  gs=0000             efl=00000246
ntdll!DbgBreakPoint:
77f7e098 cc               int     3

The header information includes the address of the heap with the corrupted block (00C81000 : Heap handle), the address of the corrupted block (00D81EB0 : Heap block), and the size of the allocation (00000100 : Block size).

The "corrupted suffix pattern" message indicates that the application violated the data integrity pattern that GFlags inserted after the end of the Pheap-buggy.exe heap allocation.

Step 4: Display the call stack

In the next step, use the addresses that NTSD reported to locate the function that caused the error. The next two commands turn on line number dumping in the debugger and display the call stack with line numbers.

C:\>.lines

Line number information will be loaded 

C:\>kb

ChildEBP RetAddr  Args to Child
WARNING: Stack unwind information not available. Following frames may be wrong.
0006fc5c 77f9e6dd 00000008 77f9e3e8 00c81000 ntdll!DbgBreakPoint
0006fcd8 77f9f3c8 00c81000 00000004 00d81eb0 ntdll!RtlpNtEnumerateSubKey+0x2879
0006fcfc 77f9f5bb 00c81000 01001002 00000010 ntdll!RtlpNtEnumerateSubKey+0x3564
0006fd4c 77fa261e 00c80000 01001002 00d81eb0 ntdll!RtlpNtEnumerateSubKey+0x3757
0006fdc0 77fc0dc2 00c80000 01001002 00d81eb0 ntdll!RtlpNtEnumerateSubKey+0x67ba
0006fe78 77fbd87b 00c80000 01001002 00d81eb0 ntdll!RtlSizeHeap+0x16a8
0006ff24 010013a4 00c80000 01001002 00d81eb0 ntdll!RtlFreeHeap+0x69
0006ff3c 01001450 00000000 00000001 0006ffc0 pheap-buggy!TestCorruptAfterEnd+0x2b [d:\nttest\base\testsrc\kernel\rtl\pageheap\pheap-buggy.cxx @ 185]
0006ff4c 0100157f 00000002 00c65a68 00c631d8 pheap-buggy!main+0xa9 [d:\nttest\base\testsrc\kernel\rtl\pageheap\pheap-buggy.cxx @ 69]
0006ffc0 77de43fe 00000000 00000001 7ffdf000 pheap-buggy!mainCRTStartup+0xe3 [crtexe.c @ 349]
0006fff0 00000000 0100149c 00000000 78746341 kernel32!DosPathToSessionPathA+0x204

As a result, the debugger displays the call stack for Pheap-buggy.exe with line numbers. The call stack display shows that the error occurred when the TestCorruptAfterEnd function in Pheap-buggy.exe tried to free an allocation at 0x00c80000 by calling HeapFree, a redirect to RtlFreeHeap.

The most likely cause of this error is that the program wrote past the end of the buffer that it allocated in this function.

Step 5: Enable full page heap verification

Unlike standard page heap verification, full page heap verification can catch the misuse of this heap buffer as soon as it occurs. The following command enables full page heap verification for Pheap-buggy.exe:

gflags /p /enable pheap-buggy.exe /full

Step 6: Verify that full page heap is enabled

The following command lists the programs for which page heap verification is enabled:

gflags /p

In response, GFlags displays the following list of programs. In this display, traces indicates standard page heap verification, and full traces indicates full page heap verification. In this case, Pheap-buggy.exe is listed with full traces, indicating that full page heap verification is enabled, as intended.

pheap-buggy.exe: page heap enabled with flags (full traces )

Step 7: Run the debugger again

The following command runs the CorruptAfterEnd function of Pheap-buggy.exe in the NTSD debugger with the -g (ignore initial breakpoint) and -x (set second-chance break on access violation exceptions) parameters:

ntsd -g -x pheap-buggy /CorruptAfterEnd

When the application fails, NTSD generates the following display, which indicates that it detected an error in Pheap-buggy.exe:

Page heap: process 0x5BC created heap @ 00880000 (00980000, flags 0x3)
ModLoad: 77db0000 77e8c000   kernel32.dll
ModLoad: 78000000 78046000   MSVCRT.dll
Page heap: process 0x5BC created heap @ 00B60000 (00C60000, flags 0x3)
Page heap: process 0x5BC created heap @ 00C80000 (00D80000, flags 0x3)
Access violation - code c0000005 (first chance)
Access violation - code c0000005 (!!! second chance !!!)
eax=00c86f00 ebx=00000000 ecx=77fbd80f edx=00c85000 esi=00c80000 edi=00c16fd0
eip=01001398 esp=0006ff2c ebp=0006ff4c iopl=0         nv up ei pl nz na po nc
cs=001b  ss=0023  ds=0023  es=0023  fs=0038  gs=0000             efl=00000206
pheap-buggy!TestCorruptAfterEnd+1f:
01001398 889801010000     mov     [eax+0x101],bl          ds:0023:00c87001=??

With full page heap verification enabled, the debugger breaks at an access violation. To find the precise location of the access violation, turn on line number dumping and display the call stack trace.

The numbered call stack trace appears as follows: The line displaying the problem appears in bold text.

ChildEBP RetAddr  Args to Child
0006ff3c 01001450 00000000 00000001 0006ffc0 pheap-buggy!TestCorruptAfterEnd+0x1f [d:\nttest\base\testsrc\kernel\rtl\pageheap\pheap-buggy.cxx @ 184]
0006ff4c 0100157f 00000002 00c16fd0 00b70eb0 pheap-buggy!main+0xa9 [d:\nttest\base\testsrc\kernel\rtl\pageheap\pheap-buggy.cxx @ 69]
0006ffc0 77de43fe 00000000 00000001 7ffdf000 pheap-buggy!mainCRTStartup+0xe3 [crtexe.c @ 349]
WARNING: Stack unwind information not available. Following frames may be wrong.
0006fff0 00000000 0100149c 00000000 78746341 kernel32!DosPathToSessionPathA+0x204

The stack trace shows that the problem occurs in line 184 of Pheap-buggy.exe. Because full page heap verification is enabled, the call stack starts in the program code, not in a system DLL. As a result, the violation was caught where it happened, instead of when the heap block was freed.

Step 8: Locate the error in the code

A quick inspection reveals the cause of the problem: The program tries to write to the 101st byte of a 100-byte buffer, a common off-by-one error.

*((PCHAR)Block + 0x100 + 1) = 0; 

Example 13 – Listing Image Files with Global Flags

GFlags displays the flags set for a particular image file, but it does not display all image files that have flags set.

Windows stores flags for an image file that the GlobalFlag registry entry in a registry subkey named for the image file in the following registry path, HKEY_LOCAL_MACHINE\ SOFTWARE\ Microsoft\ Windows NT\ CurrentVersion\ Image File Execution Options\ ImageFileName\ GlobalFlag.

To determine which image files have flags set, use Reg (reg.exe), a tool included in Windows Server 2003.

The following Reg Query command searches for the GlobalFlag registry entry in the specified registry path. The -v parameter specifies the GlobalFlag registry entry. The /s parameter makes the search recursive.

reg query "HKLM\Software\Microsoft\Windows NT\CurrentVersion\Image File Execution Options" /v GlobalFlag /s

In response, Reg displays all instances of the GlobalFlag registry entry in the path and the value of the entry.

HKEY_LOCAL_MACHINE\Software\Microsoft\Windows NT\CurrentVersion\Image File Execution Options\notepad.exe
    GlobalFlag    REG_SZ    0x00001000

HKEY_LOCAL_MACHINE\Software\Microsoft\Windows NT\CurrentVersion\Image File Execution Options\photohse.EXE
    GlobalFlag    REG_SZ    0x00200000

HKEY_LOCAL_MACHINE\Software\Microsoft\Windows NT\CurrentVersion\Image File Execution Options\printhse.EXE
    GlobalFlag    REG_SZ    0x00200000

Tip  Type the Reg command into Notepad, then save the file as ImageFlags.bat. Thereafter, to find image files for which flags have been set, just type ImageFlags.