We all get them. We all despise them. What?s the secret behind interpreting them? In this article, we delve into the basics on NT blue screens, and offer insight to help determine the causes behind a system crash.
You?ve just added some functionality to your driver...you reboot the system...your driver loads and you begin to test it and?whaaam! Your monitor pops as it?s wrenched into blue background 80x50 text-mode ? thus signaling the onset of another 3-hour search of a culprit in the guts of your driver. Sound familiar?
We?ve all come to know and love the infamous Blue Screen of Death (BSOD), with its cryptic error message and hex dumps, an example of which is shown in Figure 1. But as we?ve dealt with clients over the years, we?ve come to realize that even experienced driver developers rarely understand what kinds of information are displayed on the Blue Screen, and what conditions result in common stop codes. This article will serve as a primer on what goes on behind the Blue Screen.
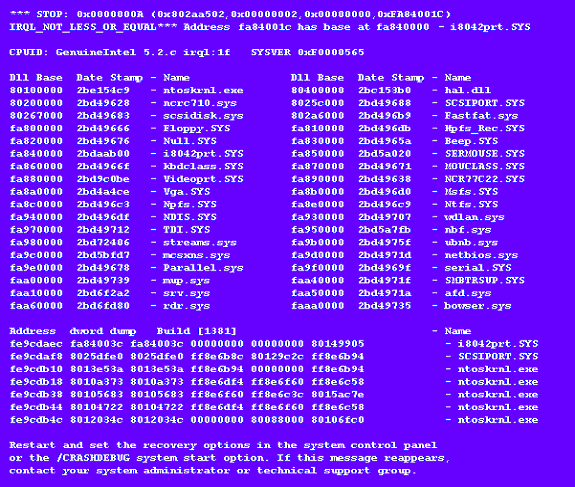
Figure 1 ? You Know What This Is!
Where do Blue Screens Come From?
Blue Screen?s are NT?s way of saying that something has gone terribly wrong and that the system has been stopped either because NT itself is baffled, or continuing may lead to data loss or corruption. The screen is thrown with a call to one of two functions, KeBugCheck(...), or KeBugCheckEx(...), both of which are exported for use by device drivers and file systems (Figure 2).
VOID KeBugCheck(
IN ULONG BugCheckCode
);
VOID KeBugCheckEx(
IN ULONG BugCheckCode,
IN ULONG BugCheckParameter1,
IN ULONG BugCheckParameter2,
IN ULONG BugCheckParameter3,
IN ULONG BugCheckParameter4
);
Figure 2 ? KeBugCheck and KeBugCheckEx prototypes
Both bug check calls take a BugCheckCode parameter. This parameter is also known as a STOP code, and generally categorizes the reason for the system halt. KeBugCheckEx(...) takes 4 additional parameters that are simply printed on the Blue Screen along with the stop code. These parameters have pre-defined meanings for some standard stop codes (some of which I?ll describe later), but a device driver can use its own stop code numbers with its own definitions for the parameters. KeBugCheck(...) does nothing more than call KeBugCheckEx(...) with the 4 parameters set to 0.
The first thing KeBugCheckEx(...) does is disable all interrupts by calling KiDisableInterrupts(...). Then it pops the machine into Blue Screen mode and dumps the stop message ("*** STOP 0x0000000A:?" in Figure 1). It accomplishes both of these operations with one call to HalDisplayString(...). HalDisplayString(...) takes one parameter, which is a string to print to the Blue Screen. It checks to see if the system is already in Blue Screen mode and if its not, it uses the firmware to switch it. Then it dumps the string argument into text-mode video memory at the current cursor position, which it keeps track of across calls. Thus, HalDisplayString(...) can be used in your own driver to throw "custom" Blue Screens, or to print informational messages to the Blue Screen that is displayed as the system starts (e.g. from DriverInit of a system-start driver). Unfortunately, if you call HalDisplayString(...) after the system is past the initial Blue Screen, there is no way to restore the screen to its previous mode (you?re then stuck in the Blue Screen).
KeBugCheckEx(...) next calls KeGetBugMessageText(...), a function that translates a stop code to its text-equivalent by using an internal table of stop names. You can see the complete set of system pre-defined stop codes and their associated text in the bugcodes.h file in the DDK. Because most of us continuously see the same 4 or 5, you might be surprised to learn that there are currently about 150 defined stop codes.
At this point KeBugCheckEx(...) calls any Bug Check handlers that drivers may have registered. A handler is registered by calling KeRegisterBugCheckCallback(...), and its purpose is usually to fill in a buffer (allocated by the caller of the register routine) with device state that can be examined inside of WinDbg when debugging a crash dump. Bug Check callbacks are also useful if the device your driver is controlling must be shut off if the system fails (a 2000-pound robotic arm is a good example). You can have the driver?s callback twiddle ports on the device in order to disable it.
Next, the system calls KeDumpMachineState(...), which dumps the rest of the text on the screen. KeDumpMachineState(...) first tries to interpret each of the 4 parameters that were passed to KeBugCheckEx(...) as a valid address within a loaded module, and stops when it can resolve one. It uses the internal function KiPcToFileHeader(...) to do this. The information KiPcToFileHeader(...) returns for the first parameter that it successfully resolves, is printed immediately following the text form of the stop code, and includes the base address of the module and the module?s name. Thus, an address parameter can be any of the 4 KeBugCheckEx(...) parameters. I?ll save an informative description of the stop codes for later.
The rest of the screen is divided into three areas (not including the message about contacting your administrator). The first is the CPUID area, below that is the loaded driver area, and at the bottom is a stack trace.
The CPUID area of the Blue Screen includes the CPUID, the IRQL setting at the time the Blue Screen is being drawn (on standard x86 HALs this will always be 0x1F ? SYNCH_LEVEL ? because the HAL disables all interrupts when it switches the video mode), and the build number. The build number, accessible via the NtBuildNumber variable that is exported from the kernel, is a 32-bit value where the high nibble is either ?C?, for Checked Build, or ?F?, for Free Build, and the rest is the actual base build number of NT (1381, or 0x565, for NT 4.0 and any Service Packs).
Below the CPUID area is the loaded driver area. Each driver in the system (kept track of with the internal variable PsLoadedModuleList has its base address and "date stamp" shown in this middle section of the Blue Screen. I have found very little use for this information, but you can use the date stamp to make sure that the version of your driver that was running on the system is the one you thought it was. The stamp is actually the number of seconds since 4:00pm, December 31, 1969, to when your driver was built, and it happens to be extracted right from the Portable Executable (PE) header of a driver. KeDumpMachineState(...) obtains it with a call to RtlImageNtHeader(...). I?m not too great at doing the math with one of those hex values to obtain the human-readable date stamp that it represents, but you can verify an image?s PE date stamp by using the dumpbin utility that comes with the Visual C compiler. Type "dumpbin /headers" to get the PE header information of your driver, which includes the date stamp.
The region below the loaded drivers section can usually provide some insight into what happened (or not). It is a stack trace that starts at the frame above KeBugCheckEx(...)?s and goes on up. KeDumpMachineState(...) will print out as many frames as will fit on the screen, unless it hits an invalid stack pointer first. The stack is read using the internal function KiReadStackValues(...), and each frame displayed consists of the frame?s address, the return address contained in the frame, the first 4 DWORDS in the frame (which may or may not be parameters stored in the frame), and the name of the module that the frame?s return address is pointing into (from KiPcToFileHeader(...)). If I see my driver in the trace, it?s a good bet that the dump is my fault, and by looking at the return address that points into my driver, I can see where it called some other function that lead to the fault. Of course, its possible that my driver caused some corruption somewhere that wasn?t detected until some later time and it won?t be listed on the stack.
KeBugCheckEx(...) then tries to connect with a debugger if the system has kernel debugging enabled. It doesn?t call-out to the debugger at that point, though. Instead, it writes a crash dump if crash dumps have been enabled, and then as its last action throws a debugger breakpoint to invoke any debugger that?s active.
Interpreting Stop Codes
In most cases the most useful information provided by a Blue Screen is the stop code and the 4 parameters printed with it. As I stated earlier, these parameters must be interpreted on a per-stop code basis. In this section I?ll provide a mini-stop code reference, covering the ones most commonly encountered, their causes, and how to interpret the parameters listed with them. Note that most of the time only a subset of KeBugCheckEx(...) parameters is used to convey information about a crash.
IRQL_NOT_LESS_OR_EQUAL (0xA)
This is one of my favorites, as I seem to encounter it more often than other types. It is thrown when the kernel or a driver determines that the current IRQL is higher than it?s supposed to be. The epicenter for most of these Bug Checks is in MmAccessFault(...), the Memory Manager?s fault handler. This function is responsible for handling page faults, and it will typically do so silently. But when the IRQL is DISPATCH_LEVEL or higher when it is invoked, it returns a STATUS_IN_PAGE_ERROR to the system page fault dispatcher. The system page fault dispatcher then promptly calls KeBugCheckEx(...) with an IRQL_NOT_LESS_OR_EQUAL.
Another place these Bug Checks can be generated is from the kernel?s worker thread dispatch function, ExpWorkerThread(...). ExpWorkerThread(...) pulls work items off a queue and calls the work routines associated with them. Upon returning from a work routine, it checks the IRQL to make sure it?s PASSIVE_LEVEL (the level it was before the work item was called). If it?s not, it throws an IRQL_NOT_LESS_OR_EQUAL. The parameters for this bug check are shown in Table 1.
|
IRQL_NOT_LESS_OR_EQUAL (0xA) (from worker thread) |
|
Parameter |
Description |
|
Param1 |
Address of work routine that was called |
|
Param2 |
IRQL that was invalid |
|
Param3 |
A copy of Param1 |
|
Param4 |
Pointer to work item data structure |
|
IRQL_NOT_LESS_OR_EQUAL (0xA) (from MmAccessFault) |
|
Parameter |
Description |
|
Param1 |
Address that was referenced |
|
Param2 |
IRQL that was invalid |
|
Param3 |
Type of access (0 == read, 1 == write) |
|
Param4 |
Address where reference occurred |
Table 1
KMODE_EXCEPTION_NOT_HANDLED (0x1E)
This code is generated from several places in the kernel, including the system?s exception handler. It occurs when an exception has occurred that the system was not expecting, and not able to handle via any exception handling mechanisms. One example of this occurs when MmAccessFault(...) gets a fault due to an invalid reference to a protected page. For instance, a driver that writes to a read-only page will generate it. Its parameters are shown in Table 2.
|
KMODE_EXCEPTION_NOT_HANDLED (0x1E) |
|
Parameter |
Description |
|
Param1 |
The exception code (see NTSTATUS.H for more): 0x800000003 Breakpoint hit with no debugger active 0xC00000005 Access violation ? in this case Param4 is the address that was referenced |
|
Param2 |
Address of the code where the exception occurred |
|
Param3 |
First exception parameter |
|
Param4 |
Second exception parameter |
Table 2
UNEXPECTED_KERNEL_MODE_TRAP (0x7F)
This code is very similar to that of KMODE_EXCEPTION_NOT_HANDLED, but is the result of a system trap for which there is no proper handler. For example, if a floating point exception occurs and the system is not prepared to handle it (like when it occurs in kernel-mode code), this exception is generated. For this type of Bug Check, the first parameter lists the CPU exception type (refer to a hardware manual to decipher it), and the other parameters are meaningless. See Table 3.
|
UNEXPECTED_KERNEL_MODE_TRAP (0x7F) |
|
Parameter |
Description |
|
Param1 |
The CPU exception code. |
Table 3
PAGE_FAULT_IN_NON_PAGED_AREA (0x50)
This ranks up with IRQL_NOT_LESS_OR_EQUAL in terms of the frequency with which I encounter it. It is generated when a kernel-mode component accesses an address that is outside of paged memory, but there is no valid mapping for the memory. Once again, MmAccessFault(...) is the source. A driver can trigger this either by performing a data reference, or by jumping off into limbo (i.e., returning from a function that has trashed the stack). The parameters are shown in Table 4.
|
PAGE_FAULT_IN_NON_PAGED_AREA (0x50) |
|
Parameter |
Description |
|
Param1 |
Address that was referenced |
Table 4
Conclusion
So that?s the magic behind the Blue Screen. In my experience the information presented on the Blue Screen serves more as a "hint" than anything else, and really tracking down a problem requires playing "corner the bug" inside SoftICE/NT or WinDbg. Both debuggers will obtain control at the point KeBugCheckEx(...) is called, so that you can sniff around for more clues. However, most of the time you have to watch the bug occur before the fault to really understand it.