|
USB Analyzer Shoot-Out
(By: The NT Insider, Volume 16, Issue 2, May-June 2009 | Published: 08-Jun-09| Modified: 08-Jun-09)
A few issues back, we wrote an article in praise of using hardware USB protocol analyzers in general and the Ellisys analyzer in particular. This sparked a discussion on the NTDEV list, and a few emails with colleagues, about other models of USB analyzers, their costs, and their relative features. The result of that discussion was our undertaking a full-blown comparative review of several available devices, and this article. That review took place during February and March 2009. Thanks to the community for once again serving as our inspiration.
We discussed previously (Don't Waste Your Time: You Can Afford a USB Analyzer, The NT Insider, Sept-Oct 2008) how useful a hardware protocol analyzer can be to a USB driver or firmware developer. The ability to actually watch the transactions that take place on the USB bus in response to your actions can be invaluable in helping you quickly and effectively troubleshoot problems.
As we've also written previously, the reason so few devs have access to a USB hardware protocol analyzer is cost. Just a few years ago, a decent analyzer could easily cost more than US$10K. In the past couple of years, however, this has changed dramatically as prices for traditional "high end" protocol analyzers have dramatically dropped, and some exciting new analyzers have become available at astonishingly low prices. In fact, you can now have your choice of first rate tools for less than US$1,200! That's a price most dev managers can be talked into approving.
In this article, we'll first describe the process we used to select and evaluate USB hardware-based protocol analyzers. Then, we'll give you our overall comparative descriptions and impressions of the devices. Finally, we'll provide our comparative evaluations and overall recommendations.
Note: Full-color, large, screen shots of each analyzer's output can be found here: www.osronline.com/usbcaptures.cfm .
The Process
To help you sort through the available options, a group of OSR staff members set out to collect and test low-cost USB hardware protocol analyzers. We talked to every manufacturer of relevant equipment we could identify, and invited them to send us their least expensive hardware protocol analyzer that could handle USB Low Speed (LS), Full Speed (FS), and High Speed (HS). Given the number of good devices available, and our readership, we specifically targeted devices costing US$1,500 or less. If manufacturers had a device that could only handle USB LS and FS, we asked them to send that along as well, and we reviewed those separately (See Little Brother Analyzers, P 19). We did not deliberately exclude any manufacturer, so if we didn?t review a device made by your friend's company we're sorry. Have them contact us and we can try to arrange to review their device in the future.
Given that he has so little to do (and actual developers are usually busying doing real work) Dan (OSR's marketeer extraordinaire) served as our interface to the outside world throughout the process. After several weeks of exchanging email, we had units from five manufacturers. Those were (in alphabetical order by manufacturer):
USB Explorer 200 Basic
International Test Instruments Pocket USB 2.0
LeCroy Conquest Standard
MQP Electronics Packet-Master USB 480
Total Phase Beagle USB 480
Table 1 shows each analyzers dimensions, weight, and cost (at the time of writing this article).

Table 1
The methodology we applied was pretty simple. The three devs at OSR with the most USB experience, namely Peter Viscarola, Mark Cariddi, and Scott Noone, each spent time working with every analyzer. While we couldn't obscure the make or model of any analyzer, the devs were not told the price of any of the units until the evaluation was concluded. During the evaluation period, the devs were not allowed to discuss their impressions of or experience with the analyzers. Devs could test each unit as many times as necessary, serially or in parallel with other units. The review goal was to evaluate each analyzer from the perspective of a Windows driver developer, or an occasional (not super expert) USB firmware developer. This means that our usage focused heavily on USB protocol analysis, with no consideration for features that the average USB driver dev wouldn't use in a debugging situation including performance analysis, critical timing, or hardware triggering. We're not saying these features might not be useful features to some devs. Rather, we're saying we didn't evaluate these features as part of our review. As it is, each of us spent about a week on the evaluations, including writing up our results and doing screen captures of various things.
In the interest of full disclosure, OSR owns the Ellisys unit that we tested. Only Peter has used this analyzer extensively. In fact, Mark hadn't used it at all, and Scott used it only casually a few years back. Thus, we don't think we were unduly prejudiced in our evaluations. Obviously, we tried our best to be fundamentally fair and unbiased in our analysis.
We used our offices as our test environments. Our goal was to use our ordinary development machines to capture and analyze traces, and one of our in-office test machines to generate USB traffic. The devices used on the USB bus varied, but always included at least an OSR FX2 board (because, ah, we had a lot of them). Mark and Scott concentrated on using the analyzers on HS buses. Peter focused on testing the analyzers on a FS/LS (OHCI) bus. To throw some fun into the mix, and ensure the analyzers didn't have any preconceived notion of how particular USB protocol sequences should be ordered, instead of Windows Peter used an unreleased, proprietary, operating system as the test host to drive the USB bus being analyzed (all his captures and analyses were, of course, performed using Windows).
The Shootout
Looking at the stack of devices assembled in Dan's office was instantly intriguing: The devices ranged in size from a slightly bigger than a deck of cards (the Total Phase and the ITI units) to briefcase sized (the LeCroy, which actually comes in its own plastic briefcase-type carrying container). The diversity in the appearance of the analyzers only hinted at the fun that was awaiting us.
We couldn't help admiring the smallest analyzers for their portability. The Total Phase is a device that's so small and so light, you could easily toss it in your laptop bag and not even know it's there. The ITI is a bit larger than the Total Phase, but also just screamed transportability. We think that most people would be comfortable enough carrying either of these devices that they'd be likely to take them on a relevant business trip "just in case."
The MQP had a larger footprint than either of the smallest two analyzers, but was easily thin and light enough to stuff into a carry-on bag or a larger laptop bag. The Ellisys is the next largest and heaviest device. While it would fit in a carry on, we felt that we'd have to know in advance that we'd actually need it before we packed it. The LeCroy is easily the largest of the devices. While it's really not that large or heavy, and you could stuff it in a carry on if you really needed to, it felt to us like something we'd be more likely to ship ahead than carry.
With the groping and ogling completed, everybody grabbed an analyzer and headed to their offices. And we immediately encountered our first set of issues.
The development systems that we all use here at OSR run 64-bit Windows Server 2003 (with the latest service packs and patches). This presented a challenge because only the LeCroy and Ellisys analyzers have drivers that support this platform. The Total Phase has 64-bit Windows drivers that are supported on Vista and later only (though we did manage to finagle them into working on S03). The ITI and MQP units do not have drivers that support 64-bit Windows, though MQP told us they are working on 64-bit drivers and expect to have them available in the future (Ed: see end of article for update) .
Not having 64-bit drivers struck us as strange. Aren't software devs the sort of folks who would be most likely to run 64-bit Windows? And, aren't these devs the folks that are most likely to use these analyzers? So, points off for any analyzer that didn't have 64-bit drivers.
Thus, before we could even start the testing, we had to change our plans slightly. Mark switched to using a pair of laptops running 32-bit Vista for both traffic generation and capture. Scott grabbed his laptop, which runs 32-bit XP, and paired it with his dev box: If the analyzer software ran on 64-bit S03, he used his dev box to do the capture and his laptop to generate traffic. If the analyzer software only ran on 32-bit software, he used his dev box to generate traffic and his laptop to do the capture. Peter stuck with his non-Windows system to generate traffic for all the tests, but used his dev box for all the analysis. Where there were no appropriate drivers for his dev box, he did his captures from a 32-bit laptop running Windows 7, where the analyzer software was run in Vista compatibility mode and elevated with admin privileges (just because). He then transferred those captures to his dev box for analysis.
Pain in the ass, huh? Yeah, we thought so. You can take it as a sign that we're trying to be as professional and unbiased as possible in this review that we don't hold forth in great detail, and editorialize more fully and colorfully, on the topic of analyzers not having 64-bit drivers. Ouch! That was the sound of me, biting my tongue. But I digress.
The Shootout, Reloaded
We finally got down to the job of actually using and testing each of the analyzers. This entailed capturing and analyzing protocol traces to determine the activities of each device on the USB bus.
Data Capture
Most of the analyzers capture data from the USB bus in a capture buffer, and then after the capture is stopped, they allow you to display the previously captured data with various levels of interpretation. The exceptions to this were the Total Phase and ITI analyzers. Both of these decoded and displayed captured data in real time, as well as capturing it to a buffer for later analysis. The Total Phase displayed captured packets. The ITI displayed decoded data at the transfer level, as well as providing an on-going count of token packets, data packets, and other similar events seen.
While capturing, the MQP and Ellisys analyzers both display the number of packets captured, as well as a count of ACKed and NAKed transactions. The Ellisys also displays the number of individual devices detected while the capture was being made, which is handy. The LeCroy doesn't display useful information, other than whether the capture has been triggered or not, during the capture. We can't say this is a terrible failing, but it's not as nice as the other analyzers.
Setting up capture sessions with the analyzers was simple, as expected. You plug one port of analyzer into the machine doing the capture, and you put the analyzer "in line" with the USB Bus you'll be capturing data from. All the analyzers, except the LeCroy, were fully bus powered. The LeCroy had to be plugged into AC power.
Capturing data with most of the analyzers was easy to figure out. The analyzers with the simplest capture and analysis programs typically had one very obvious way to start the capture. For others, you had to determine which semi-cute icon on the tool bar corresponded to "start capturing" or else find the "start recording" or similar item in one of the program's menu items (Mark: "Thank God for tool tips"). In any case, it was typically pretty easy to determine how to grab data.
The only exception to the above was the LeCroy. The LeCroy seems to be modeled more on the lines of a hardware analyzer, like a logic analyzer. Before you can start a capture, you need to define a "trigger", which can be "any transaction" on the USB bus or a number of other options. You then selected the maximum size of the capture, and the amount of "pre-trigger" space allocated for the capture, and clicked "run" to start waiting for the trigger to occur to start the capture. This process caused lots of initial head-scratching among the reviewers and just felt unnecessarily complicated. Once the desired trigger conditions are established, they can be saved (as an analyzer "project") and later recalled to start another with the click of an icon on the tool bar. Thus, thankfully, you only need to perform the trigger configuration process on the LeCroy once.
It's important to note that the LeCroy was not the only analyzer that offered options for when to start a capture. Some analyzers feature complex triggers as part of their basic configuration, on others it's an extra cost option. So, if triggering on a given protocol sequence or some other condition is likely to be important in your environment, be sure to check for this feature on all the analyzers.
One final triggering option worthy of note is that the MQP has physical buttons on its front panel that allow you to start and stop the capture. Scott, particularly, found this useful. The LeCroy has a similar manual trigger button, but to use it you need to select a project that has "manual" as the triggering criteria.
We had absolutely no problems capturing data with most of the analyzers. Two of the three reviewers occasionally had a capture problem with the MQP analyzer. The symptoms were that the analysis program would hang at the end of a capture when selecting "Save and Display." MQP's tech support was quick to respond to our report, but was unable to solve the problem in the time we had available. In any case, we were able to work around the problem by doing the same operation in two steps: Selecting "Save Only" to end the capture and save the data, and then opening the just saved capture for display. It was an easy work-around, and not too inconvenient, but a bit of a surprise nonetheless.
Mark and Scott, who tried using the ITI analyzer to capture data in HS USB configurations, had more serious difficulties. Capture attempts with the ITI analyzer at high speed resulted in no data. We reported this problem to ITI and they had an updated firmware release for us to try within hours. While this fix allowed us to capture data for one of the devices (a USB flash drive), the fix didn't allow us to capture data from the OSR USB FX2 card. They continued to work with us, but couldn't completely solve the problem in the limited time available. As a result, after several unsuccessful attempts at using the device, Mark and Scott discontinued their attempts to evaluate the ITI.
Analysis Overall
Once the data is captured, what is it like to perform the analysis with each of the products? Each of the capture analysis programs (with one exception) can display captured data at three levels of analysis.
-
Packet Level: This is the lowest level of data (such as IN, OUT, SETUP, DATA0, DATA1, ACK, NAK, etc), and corresponds to individual packets on the USB bus.
-
Transaction Level: This level groups the packet data into transactions. For example, a single Setup Transaction corresponds to the packets Setup, Data0, ACK (in that order).
-
Transfer Level: This level represents a group of transactions gathered together into a single operation. For example, a Get Descriptor Transfer comprises a Setup Transaction, an IN Transaction, and an OUT Transaction.
One thing we noticed was that several of the analysis software packages are updated frequently. All of the vendors provide easy downloads of the latest software from their web sites. Before using one of these tools, you should always download the latest available software.
Note: We've place full-screen sized, color, screen captures of the analysis software on OSR Online at www.osronline.com/usbcaptures.cfm.
Analysis: Total Phase
The Total Phase displays Packet Level analysis of observed USB traffic in its main display with some added Transaction Level interpretation in text (not table) format in a secondary window. Transactions are grouped together with color coding. Consecutive SOFs and NAKs are each totaled and combined in the display. Reasonably sophisticated filters, based on device or endpoint address (for example), can also be applied to the display.
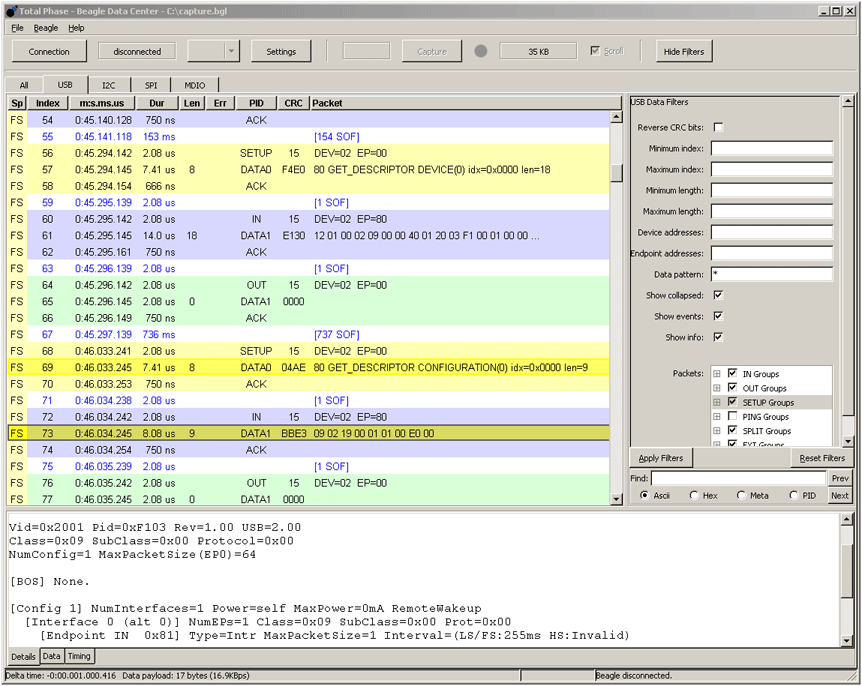
While the Total Phase analysis program had the least sophisticated look-and-feel of the analyzer packages we tested, the software itself was solid and reliable in what it did. Total Phase told us that they are working on a much enhanced version of their analysis software (we saw a video of the new package that looked quite impressive). This new version should be available in the near future.
Analysis: ITI
The ITI analysis program groups each Transfer in what looks to be a pretty standard Tree Control. You open the Transfer Level and see under it the Transactions that comprise that Transfer. You open each of those Transfers and the program displays the Packet Level information. When a Transfer, Transaction, or Packet is selected, additional information (formatted for easy understanding) is displayed in a separate window in the analyzer.
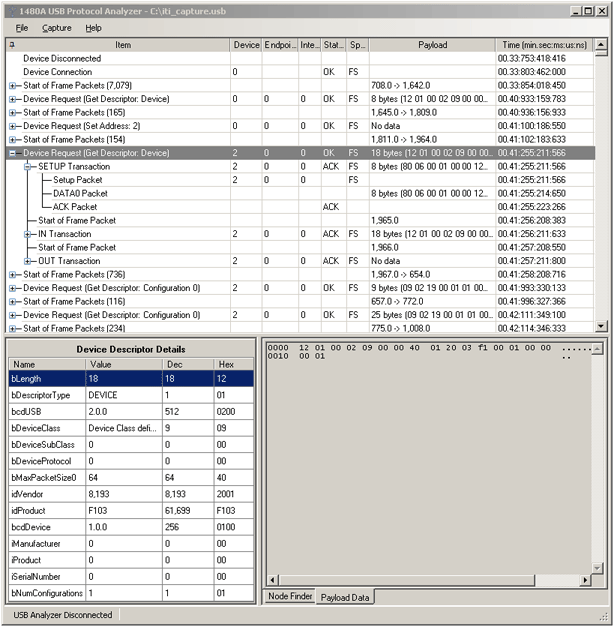
The ITI software provided an analysis display that was generally clear and easy to use. Consecutive SOF packets were grouped in transactions (which you could open to see each of the individual SOFs). There's also a handy "Node Finder" window that allows you to jump directly to a particular Transaction, packet type, or even transaction (for example, you can jump to the next "Get Descriptor" request).
One problem we had with the analysis output from the ITI was that we couldn't find any way to suppress consecutive NAKed IN transactions. This made analyzing the activity on the bus in certain situations very difficult. For example, if you're analyzing a device on a hub (where there's always a hanging IN on the hub's interrupt endpoint that's used to signal hub status change) you'll be searching for your device's data amid zillions of NAKed INs.
MQP
The MQP, like the LeCroy, has a graphical display of transfers, transactions, and packets.
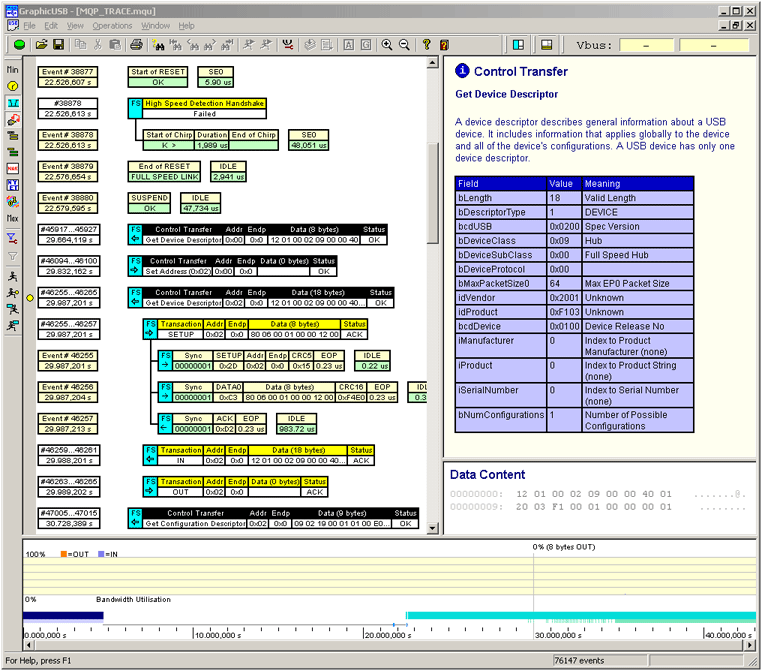
The user double-clicks on a particular level to open/close the next lowest level. For example, in the figure below, the user double clicked on the Get Device Descriptor control transfer to reveal the transactions within that transfer. The user then double clicked on the SETUP transaction to reveal the packets within that transaction.
SOF, NAKs, and NYETs can be either shown or filtered from the display. It's also possible to create relatively sophisticated filters, to show only particular devices or endpoints.
Like several of the other analyzers, additional data for each transfer, transaction, or packet is shown in a separate window.
Note that, along with the data itself, the MQP shows some additional tutorial information. In fact, all the analyzers except the LeCroy and ITI provided some amount of tutorial information along with the data being displayed. This information is often taken directly from the USB specification. The reviewer's response to this was decidedly mixed. From Scott's notes: "I don't work with USB every day and it can be days/weeks/months/years between when I need to look at things in this level of detail, so quick access to this kind of information is incredibly handy." On the other hand there's Peter's note: "Several of the packages include gratuitous help, such as quotations from sections of the USB spec. This gets old quickly and should be disable-able. If you don't know what a NAK is, fine - go look it up."
The reviewer's reaction to the MQP analysis display was also mixed. Mark was "was much happier with a line by line display than the graphic display used" by the MQP. Peter on the other hand, found the combination of graphic display for the protocol and secondary window for interpreted data "VERY nice", "impressive" and found it "VERY easy to see the data flow direction, whether a transfer is FS, HS, or LS, and the TYPE of transfer. For example, the display clearly indicates "BULK Transfer" or "Control Transfer". This is elementary, but useful."
The reviewers were united, however, in the feeling that "a lot of scrolling" was required to find the info they were looking for (yes, there IS a comprehensive search facility that we could have used). Scott thought the UI felt "a bit sluggish" on his laptop, and Peter concurred. In general, the reviewers wished for a more compact mode for the display that would allow more transfers on the screen at one time.
Analysis: LeCroy
The LeCroy, like the MQP, provides a graphic display of the protocol information, featuring Transfer, Transaction, and Packet views:
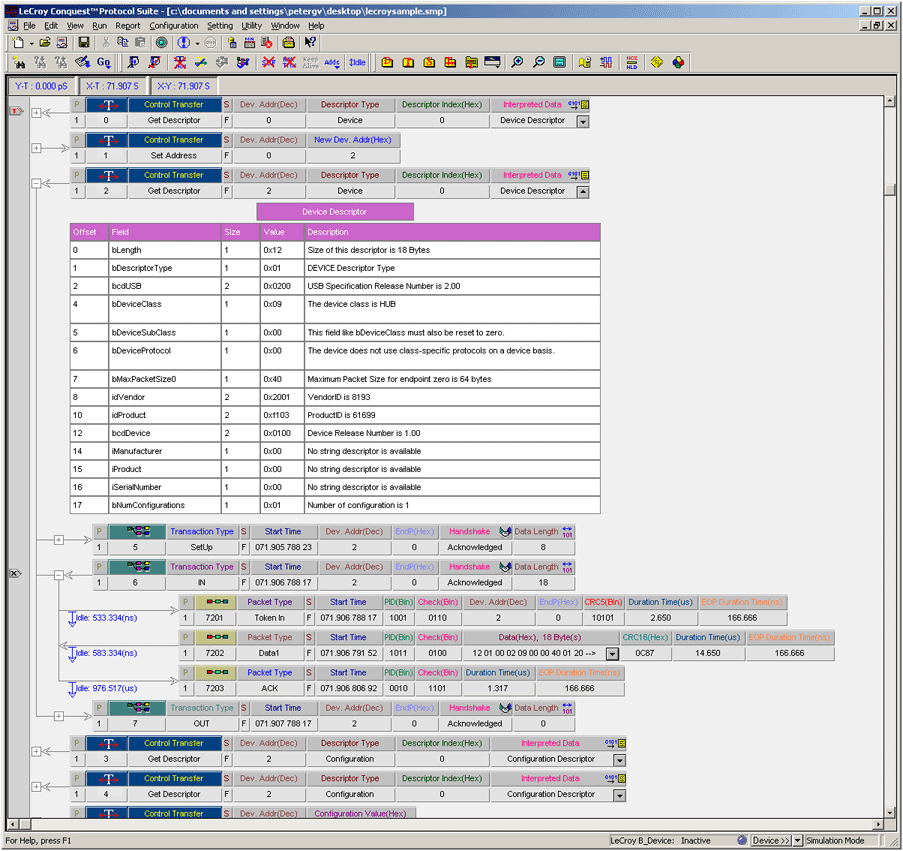
The user clicks the "+" sign to see the next level of information for a given Transfer or Transaction. The LeCroy can also display interpreted information (or the contents of data fields) for specific Transfers or Packets. However, instead of putting this display in a secondary window like some of the other analyzers, the LeCroy puts the data directly "in line" when the user clicks the down arrow for a particular item.
While the interpreted information display is great, the reviewers thought using an alternate window to display the information (as is done by other analyzers) was more convenient, and took less screen real estate away from the protocol flow.
The LeCroy has a complete set of filtering options, and can easily disable the display of SOFs and NAKs.
While the LeCroy's graphic display was similar to that of the MQP analyzer, the LeCroy display appeared more compact, and in fact could be configured to be even more compact by setting certain display options. However, even at its most compact, the LeCroy display wasn't able to show as many operations on the screen at one time as the Ellisys or ITI.
In use, the LeCroy software felt very complete and well implemented. There are tons of options. Everything seems to be configurable and customizable, from the colors of the display to the radix used for each individual data field. Peter called the software "CRAZY configurable", which is high praise.
The reviewers were mixed in their overall impressions of the LeCroy analysis software. Scott called it "the Adobe Photoshop of USB analyzers - it can do just about anything if you take the time to learn how to use it." However, he concluded that it was "simply too much tool" for his occasional use as "a lowly software guy." Mark felt "the other programs were much easier to use" but recognized that the software was probably "more sophisticated than [some] others." Peter noted: " It took me about an hour to become productive with the [LeCroy analyzer], and to be able to find what I needed (and - more importantly - limit the trace stuff that was being shown, as the SOFs and NAKs rarely interest me)." In retrospect, he acknowledged that he continued learning things about the software long after that hour.
Analysis: Ellisys
The Ellisys analysis software is also a "text grid" style display, using a tree control.
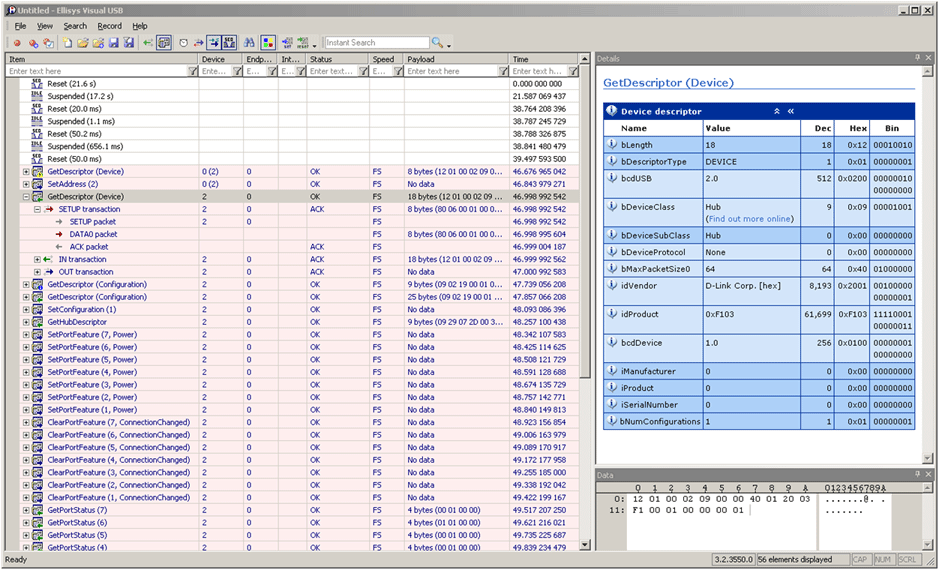
As with almost all the other analyzers, the Ellisys grouped Packets into Transactions and Transactions into Transfers. The user clicks on the "+" sign to open the next lower level for display.
The Ellisys was among the more compact - and in the opinion of the reviewers one of the easiest to understand - displays. It also includes a secondary window that's used to show additional data such as the interpreted contents of a descriptor.
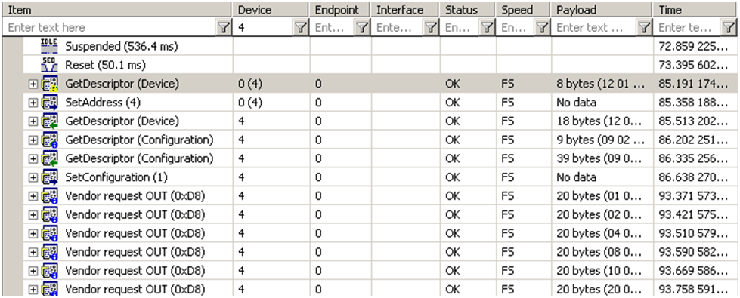
Each of the three reviewers noticed, and commented positively about, the convenience of the "Instant Filter" facility in the Ellisys software. This is a set of boxes at the top of the column list into which the user can enter values that are immediately applied as filters. For example, the partial capture of the display below shows the display filtered to show only device 4, by entering that number into the "Instant Filter" at the top of the column.
All agreed the Ellisys software felt well designed and implemented. Mark noted that the application was "well thought out, clear and quite detailed" and "easy to warm to and more intuitive than some of the others." Scott commented that the analysis software was "very clean and modern feeling" and "was all very intuitive" to use.
The Ellisys software has several interesting touches that make it pleasant and convenient to use. For example, an option color-codes the Transfers/Transactions/Packets on a per-device basis. Another such feature is shown above. Note that during the first "Get Descriptor" Transfer (at time 85.191, highlighted) and the "Set Address" Transfer immediately following it (at time 84.358) the device number is shown as "0 (4)" - This indicates that device address 0 was actually used in the Transfer (which is the address used by a device before it's configured on the USB Bus), but that device was eventually assigned device address 4. This feature isn't a big deal, but is pretty typical of the thoughtfulness and level of detail in the Ellisys software.
Peter wished that each Transfer was clearly labeled "Control Transfer", "Bulk Transfer", as in the MQP. The little icons that presumably indicate this are too small and too similar (and didn't even have tool tips associated with them that would give a hint).
During our testing, we noticed one seeming anomaly in the Ellisys software. Under certain circumstances, the software grouped Bulk IN and Bulk OUT Transfers together, even if they were separated by other packets or by many seconds (or minutes) in time. We thought this resulted in a confusing display, so we checked with Ellisys. Their engineering team was highly responsive, and within a day they had confirmed that the behavior we were seeing was "by design" but that they could also understand how in certain circumstances the display that resulted with less than helpful. Thus, they sent us a new version of the software that disabled grouping of Bulk IN and Bulk OUT Transfers, and promised to add this feature to their next software release which is due out very soon.
Recommendations
We thought doing a USB Analyzer shootout would be much easier than it turned out. In the end, we discovered that this review stuff is real work. But we learned a lot and had a good time.
We're going to give you our recommendations, based on our experiences and the criteria we've described. Keep in mind that there are differences in these analyzers that we've only briefly touched - or that we haven't mentioned at all (such as built-in class decoding). Some of these features are included in the base price of some analyzers, and cost extra in others. So if features other than those we've specifically mentioned are important to you, be sure to do your homework and not simply adopt what we say. We were both amazed and excited by the size of the Total Phase and ITI analyzers. As soon as we laid our eyes on these units, we couldn't help but want one. However, despite the fact that it had a 64-bit driver that worked on Vista, the Total Phase analysis software displayed only a basic Packet level display and didn't have nearly the capabilities of the other analyzers. That precludes us from recommending it at the present time. Keep an eye on this unit, though, as Total Phase promises new analysis software will be available soon (as a free download). The price of the Total Phase analyzer is $1200.
The ITI's software was simple and easy to use, though not quite as powerful as that of some of the other analyzers. However, the analyzer had multiple problems capturing data on USB HS, and there are no 64-bit drivers available. As a result, we can't recommend this analyzer either. However, it's clear that the ITI folks are actively working on their firmware and software, and if they can solve the existing issues they'll have a package that's hard to beat in terms of price ($599) and portability.
The remaining three devices, those from Ellisys, LeCroy, and MQP, all deserve careful consideration if you're in the market for a USB hardware analyzer. Personal preferences and usage scenarios could easily cause you to prefer one over the other.
The reviewers considered the LeCroy the "big daddy" of analyzers. Not only was the analyzer hardware physically the largest of all those tested, the software was the most complicated to learn and use. The price wasn't as large as any of the reviewers expected, however, with a cost of $1199. Most felt that this analyzer would be more at home in a hardware developer's lab than with a "lowly" software dev. However, the software's complexity added flexibility and options that no other analyzer had. It's also important to note that the LeCroy's 64-bit drivers worked flawlessly on the reviewers systems. While this device wasn't the first choice of any reviewer, all agreed that they could use this device to get their jobs done.
Peter found the MQP's display probably the most intuitive to understand, but didn't like the amount of screen space the graphic display occupied. Mark found that same display less intuitive than others. Scott liked it, but agreed space utilization was a concern. The fact that this device had hardware buttons to start and stop a capture was a plus. All liked the fact that the MQP was easily "packable" for a trip. However, a serious negative for us, at least, was the lack of 64-bit drivers (Ed: In fact, the a 64-bit driver is available for download now) . At a price of $1199, the reviewers felt the MQP was a serious contender, but not the top choice. It, did, however earn two votes for "runner up."
The reviewers were unanimous in their appreciation of the Ellisys analyzer. The software felt "polished" and was easy to use and was thoughtfully implemented. The analysis software was also judicious in its use of screen space. The 64-bit drivers worked perfectly on the reviewers workstations. The only negative was the size of the Ellisys hardware: It's not something any of the reviewers would want to throw in their bags "just in case" when leaving on a trip. However, this is a minor issue. With a base price of US$799, the Ellisys was the reviewers pick for "best overall analyzer" in the shootout.
This article
was printed from OSR Online http://www.osronline.com
Copyright 2017 OSR Open Systems Resources, Inc.
|