Up until recently, Windows NT device driver writers had exactly one choice for a debugger: WinDbg (yeah, there’s i386kd, but you’ve got to be pretty masochistic to use it). WinDbg comes as part of the Win32 SDK, and provides an array of powerful commands and features aimed at making our work in kernel-mode easier. However, it has a few really irritating shortcomings that have resulted in its more popular name, "Wind Bag". For example, it can be a real pain to set up for the first time on a machine. And calling it temperamental is being kind, as it loves to crash, or hang almost randomly, and sometimes quite frequently.
In the summer of last year, Nu Mega Technologies introduced a version of their famous SoftICE line for Windows NT®, creating an alternative to WinDbg. SoftICE for Windows NT, which I’ll refer to as NT-ICE from hereon, is superficially identical to its cousins, SoftICE for DOS, SoftICE for Windows 3.x and SoftICE for Windows 95. This makes coming up to speed with it a no-brainer if you’ve come from device driver development on one of these other platforms, and gives you a unified debugging environment if you migrate drivers from platform to platform.
It runs on the machine you are debugging and pops-up, or takes over the video screen, when it is in an interactive, command-driven mode. While its initial release, NT-ICE 2.0, made single-computer debugging for x86 NT device drivers a reality, its inability to display local variables and structures restricted its use to those developers who had managers too cheap to buy a second machine for use with WinDbg.
NT-ICE 3.0, which began shipping in December, contains Nu Mega’s revamped symbol engine technology and has made NT-ICE more than just a tool for small budgets and assembly language gurus. Should you drop WinDbg and get NT-ICE? It depends on what you want and what you need. It still is not a panacea for debugging drivers because it does have its weaknesses. In this article we’re going to take a comparative look at the two debuggers with regard to ease of setup, ease of use, features and limitations. So get out your checklist of debugger must-haves and start keeping score.
Ease of Setup
This category is an easy win for NT-ICE because WinDbg is notoriously difficult to configure. With WinDbg, you must prepare for two-machine debugging by obtaining a null-modem cable, identifying COM ports and speeds, and twiddling BOOT.INI parameters on the debugging target computer. If you’ve gotten that part right, and then you graduate to setting up the debugging host computer’s symbol search path and symbols. Finally, you might have to tweak things to get the client and host to begin talking to each other. The DDK makes it sound easy, but even after carefully following these steps I’ve wasted a lot of time trying to figure out why WinDbg hangs when the target boots, why it complains about mismatched or unfound symbols, or why it just doesn’t react to breakpoints.
Setup for NT-ICE on the other hand, couldn’t be more to the opposite extreme. You simply run the install program tell it what kind of mouse and video card you have and when during the boot you want NT-ICE to start, and you’re done. Unless you told it the wrong video card, which it verifies for you, you can’t screw it up.
Ease of Use
When I say, "ease of use," I’m not referring to the ability of one or the other debugger to make your debugging easier. Rather, I’m focusing on user-interface issues. WinDbg’s interface is shown in Figure 1, and consists of an MDI window similar to what you’ll find in the Visual C debugger, although the keyboard mappings are different and WinDbg is not a CUA compliant MS application. Sub-windows can be made visible for command entry, memory dumps, register viewing, local variable and expression watching, and source code browsing. Operations like setting breakpoints can be performed through the command window, or by highlighting code with the mouse and clicking a tool menu button or selecting an option in a dialog box. Having a GUI that can take advantage of your 21-inch monitor is a very nice convenience.
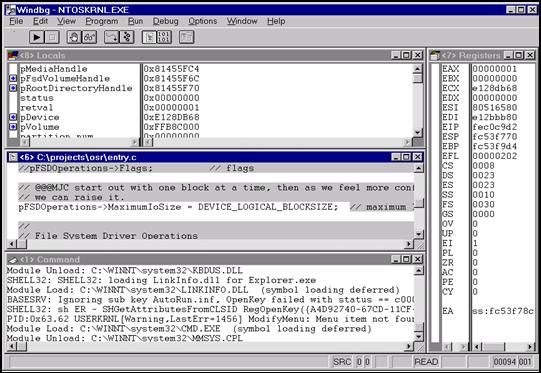
Figure 1
For all of WinDbg’s versatility, its interface still has some pecularities. Novice WinDbg users have a hard time determining how to perform common operations: is it a command window command, menu item entry, dialog box setting, or mouse action? In addition, WinDbg’s documentation leaves something to be desired: you’ll find only a hand-full of pages in the SDK and DDK describing its use and commands.
Because WinDbg is a two-computer debugging solution, any data output on the host machine has to travel across a serial cable. This can have a noticeable effect on its responsiveness, and can slow down your target machine significantly when you have a driver spitting out lots of trace information. Rapidly stepping through code is painful, and getting WinDbg’s attention (i.e. halting the target machine) can also be problematic and take more than a second or two in some cases.
The NT-ICE user interface, pictured in Figure 2, has the same, if somewhat more restrictive, sub-windows as WinDbg. Since NT-ICE’s interface runs by flipping the system video card into VGA text mode, its limited to at most 80 columns by 60 lines (note: NT-ICE can display output on an attached monochrome monitor if you have a separate monochrome graphics card). This makes real-estate really tight, and although the mouse has some support, you’ll do much more typing in NT-ICE than WinDbg. Speaking of its mouse support, newly revamped in 3.0, it is now possible to copy and paste text and/or data, as well as resize the window panes, using the mouse.
Unlike WinDbg, NT-ICE comes with a very thorough user’s guide and command reference manual. Quick start instructions can get a first timer into the midst of driver debugging within 10 minutes. Still, NT-ICE’s large command set is daunting, and even experienced users are many times unaware of useful features.
An advantage of having NT-ICE run on the machine being debugged and not through a serial line is that it is extremely responsive. You can instantly grab its attention, quickly browse hundreds of kilobytes of memory, and have it collect thousands of lines of trace data with no visible effect on the system’s performance.
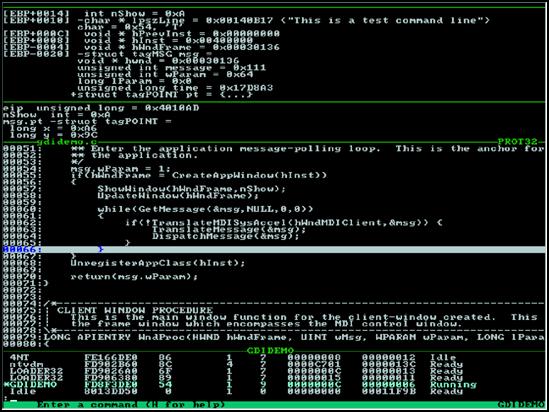
Figure 2
Which is the winner in the ease-of-use category? In my opinion its a pretty even split. NT-ICE’s DOS-program style screen makes some developers gag, but it does provide all the power of WinDbg’s multiple windows. WinDbg’s interface gives one the impression that development was halted on it right after they shipped the Alpha release, because all it needs to be really smooth is a once going over. If its progress since NT 3.5 days is any indication, that will never happen (compare the NT 3.5 WinDbg bug list with the NT 3.51 WinDbg bug list in the Win32 SDK Knowledge Base and then see if any have been fixed in NT 4.0).
Features
The feature lists for NT-ICE and WinDbg are for the most part pretty comparable. Both tools have the basic ability to view and manipulate local and structure variables, set conditional break points, change process contexts, dump thread, process, and IRP information, go tooling through the system’s memory and page tables, and read and write I/O ports. Each prints out slightly different information when dumping system structures, but both address the most interesting fields.
Differences start to surface when you look at what is one level deeper. For example, WinDbg has commands that let you view all the outstanding IRPs on the machine, and even list the IRPs that are associated with a particular thread. It also lets you dump tagged pool usage, something that can be used to quickly uncover memory leaks. NT-ICE does not provide these capabilities, but it does have some valuable tricks up its own sleeve.
When running on a Pentium-class processor, NT-ICE makes use of the built-in cycle counter to display highly accurate elapsed times between breakpoint hits. This can be a big aid in driver performance tuning, and can even give you clues about the way your hardware is behaving. For those of you that are debugging the interactions between a user-mode application and your driver, or want to understand the symbiosis of the Win32 subsystem and NTOSKRNL, NT-ICE is essential. Unlike WinDbg, which cannot follow execution up into user-mode, NT-ICE treats user-mode/kernel-mode transitions transparently. This allows you to set break points in Win32 applications or native DLLs, and follow their progression into and out of kernel-mode services or drivers.
Limitations
WinDbg’s limitations include its flaky behavior, lack of documentation, and its total lack of support. It does run on all supported NT platforms, including RISC machines, and more importantly, it works on multiprocessors.
NT-ICE only runs on x86 platforms, which can be major limitation if you are developing drivers for other platforms. In addition, it will run on multiprocessor machines, but only when all but one CPU is disabled using the /ONECPU BOOT.INI switch. This is NT-ICE’s major flaw. Without SMP support, it’s impossible to track down those pesky synchronization problems that only show up on your dual processor P200. Inside sources have informed me that Nu Mega is hard at work making an SMP version, because without it, NT-ICE can really only serve as a tool that works in conjunction with WinDbg, rather than replacing it.
The fact that NT-ICE runs on the same machine being debugged is also considered a limitation by some people. The interface-responsiveness that this brings with it a huge win in my book, but others will argue that its large memory footprint and complex interaction with the machine can lead to ambiguity as to whether its your driver or NT-ICE that’s at fault when something goes wrong.
Ironically, NT-ICE’s SMP limitation and the rumor that it is being remedied highlights the advantage NT-ICE has over WinDbg, that it is a work in progress. Its certain that as patches and new releases are made to NT-ICE, it will include more information dumping capabilities (like dumping tagged pool and listing IRPs), and more built-in debugging aids. WinDbg development has been, at the best, sporadic for the past 3 years, and its unlikely to go mainstream anytime soon.
Conclusion
NT-ICE and WinDbg offer the same basic debugging capability in two different flavors. NT-ICE is a robust, documented, single-computer debugger, while WinDbg is a flaky, undocumented and unsupported two-machine solution. On the other side of the coin, NT-ICE only runs on single processor x86 machines and has an interface that is a throw-back to pre-CodeView for DOS days, and WinDbg runs on all supported NT platforms, including SMPs, and has an (almost) modern Win32 GUI front-end.
Which is better? The winner in many cases will be dictated by the demands of the projects you work on. If both are suitable, it boils down to your personal preferences. I work with both, using them when their respective strengths are called for, but this is not practical for everyone. After all, you get WinDbg by default and NT-ICE lists for around $600 (US). For more on NT-ICE, as well as ordering and pricing information, point your browser at http://www.numega.com.


 Post Your Comment
