Change is hard. When I first heard that the new WDK would be integrated with Visual Studio, I, just like a lot of people, pitched a fit. In my mind, Visual Studio is too bloated and complicated. I already have a lightweight editor (SlickEdit), a lightweight debugger (WinDBG), and a build system that makes sense to me. Why would I want to throw this all away just to have some hideous IDE crammed down my throat?
To prove a point (to no one but myself, really), I ran a test to see how many of my development environments I could bring up before VS even launched. Between the time I clicked the VS icon and when I was presented with the Start Page, I was able to launch:
-
12 Build Environment Windows
-
17 WinDBG Instances
-
An entire project consisting of four drivers
Clearly my current environment is more streamlined and VS is a pig, right?
Well, turns out, yes and no. When I finally decided to put my hubris away for a little bit and, gasp!, actually tryto find some good in the change, I discovered that there’s quite a bit to like here. There’s definitely going to be some growing pains and not absolutely everything is great, but here’s a list of five things that I had to tip my hat to.
1. Configuring Symbols via the GUI
Remember how annoying it was to have to remember the full path to the Microsoft Symbol Server? Probably not, because .symfix has alleviated us of that need for quite a while now. However, keeping your symbol search path correct across multiple WinDBG workspaces is always a pain. Also, trying to parse that long, wrapping, semicolon delimited symbol search string when something isn’t working is never fun.
Given that, it was with great joy that I found the Symbols editor in the VS Debug->Options and Settings dialog, shown in Figure 1.
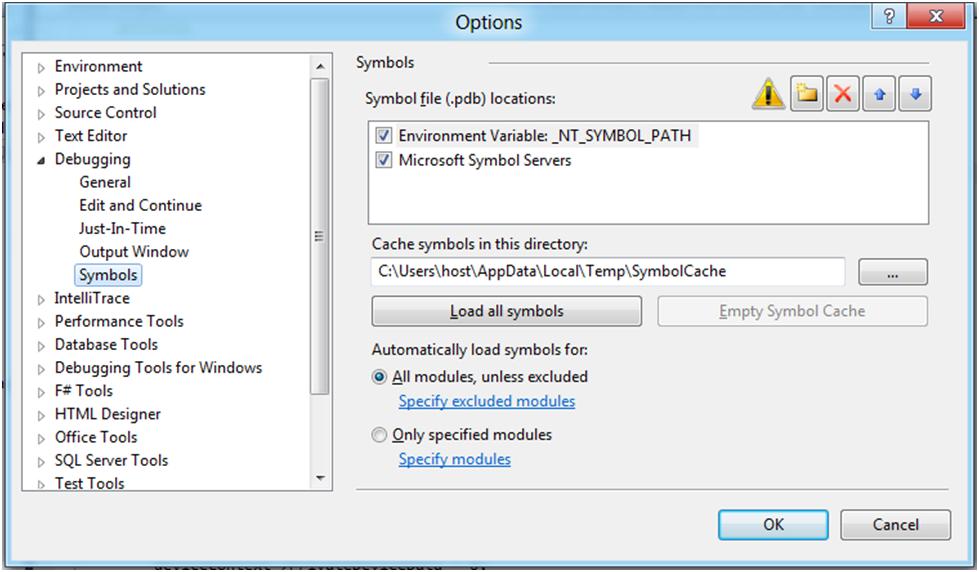
Figure 1
The GUI makes it exceptionally clear where the debugger is looking for symbols and you can even quickly edit the priority of the locations by moving them with the up and down arrows.
As an added bonus, you can even exclude or include the loading of symbols for specific modules. This is great for avoiding the time spent going over the network for symbols that will never be on the Microsoft Symbol Server, such as third party driver symbols. This option has been available in WinDBG for a long while, but required magical incantations found only in a random MS Word document shipped with the debugger.
2. Better Experience Setting Breakpoints via the GUI
Using the WinDBG GUI to set breakpoints has always been a bit of a hassle. First off, you need to remember to break into the target before setting the breakpoint. Next, your driver had better already be loaded or you’ll be punished with a long delay followed either by an error or no visual clue of whether or not your breakpoint was set. You’re then forced to just, “try it” and see if the breakpoint was actually set or not.
Using VS, you’re no longer responsible for stopping the target to set the breakpoint; All you have to do is open your source and hit F9. If the target is running, VS will stop the target, set the breakpoint, and then resume it seamlessly. In addition, it also doesn’t matter if your driver is loaded or not. Just hit F9 and VS will set an unresolved breakpoint and, more importantly, will display the breakpoint in the GUI as it would any other breakpoint (see Figure 2).
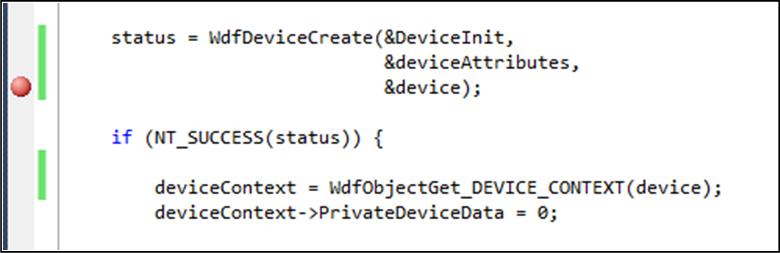
Figure 2
3. Suppress PREfast Warnings via the GUI
I’m all for anything that helps us write better code. For the annoyance it caused in the beginning, it’s hard to say that PREfast doesn’t do just that. However, for all the times that it does right by me, the times that PREfast is wrong or spurious make me insane. All I want is for the warning to go away, but can never quite seem to remember the magic #pragma incantation to suppress the warning. This generally results in me searching my projects directory for, “#pragma” and looking for the last time I had to suppress something.
You can imagine then how excited I was when I discovered that not only can PREfast be run via the GUI, but the warnings can also be suppressed with a few clicks (see Figure 3).
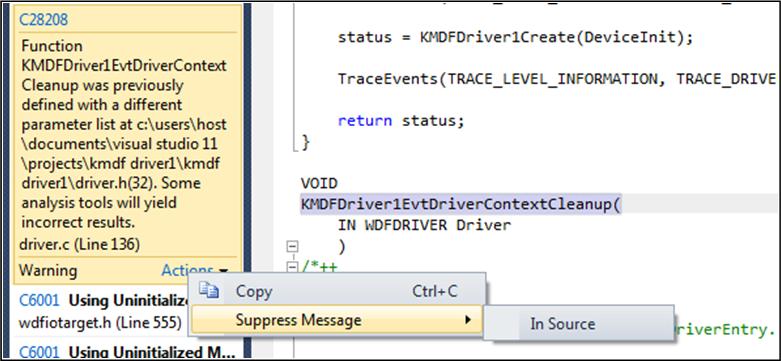
Figure 3
Suppressing the message adds the appropriate #pragma to make the warning go away, as can be seen in Figure 4.
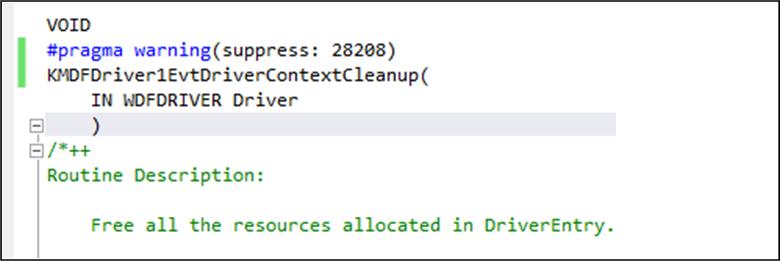
Figure 4
You’ll note, however, two down sides to the automatic suppression. First, I’d like to see the suppression using a pre-defined constant with a meaningful name for the warning number. During a code review, I’d have absolutely no idea what warning 28208 was, which would make me wonder if it should really be suppressed or fixed. In addition, I’d like to see the suppression put some stub text either above or as part of the #pragma that leaves room to explain the warning. Again, when someone comes back to this in the future it would be nice if it was very clear about why this was suppressed instead of fixed.
4. Intellisense for Debugger Commands
This one doesn’t need much explaining and it’s just awesome once you’ve had a chance to use it. Start typing out a WinDBG command and you’ll be greeted with a list of matching commands and even some documentation, as can be seen in Figure 5.
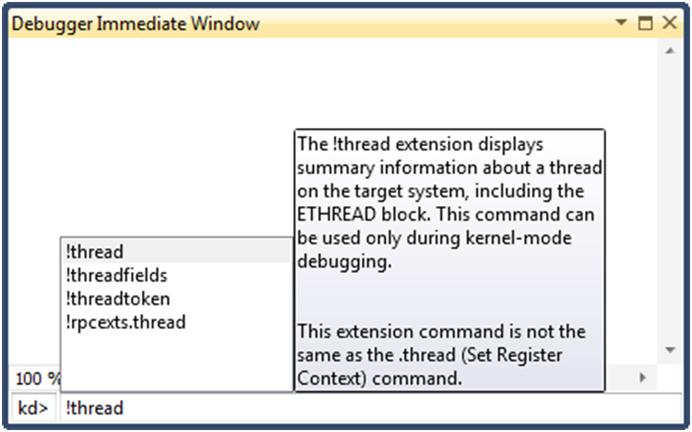
Figure 5
Sometimes you even get information about the parameters to the command, as can be seen with .show_sym_failures in Figure 6.
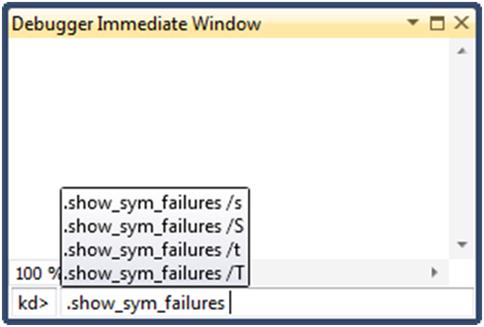
Figure 6
My only complaint at this point with this feature is that parameter information isn’t shown for all commands. Hopefully as the support matures we’ll get that in the future.
5. Automatically Configuring Target Machines for Debugging
I don’t think that I need to convince anyone that BCDEdit is cumbersome and cryptic. If I’m not using the default debug configuration of COM1 at 115200, I’m lost when it comes to configuring a target machine for debugging. Luckily for all of us, those days are now over given the new support in VS for automatically configuring target machines. We’re covering how to configure a target machine for debugging via the UI in another article in this issue (see WDK Preview: Installation Through Debugging), so I won’t go through that again here. However, when it works, debugging is just a click away and that’s pretty awesome.
One gripe I have about this is that when you configure the target machine for kernel debugging it doesn’t add a separate BCD entry for debug. Thus, you’ll be forced to always boot with the debugger enabled unless you change the settings during the boot process by hitting F10.
What’s Do You Think?
What are your impressions after playing with the preview? Agree with the things we like here? Disagree? Have your own? Let us know! And be sure to check out our other article in this issue, Five Things to NOT Like About Visual Studio Integration.


 Post Your Comment
