By Ivan Shcherbakov
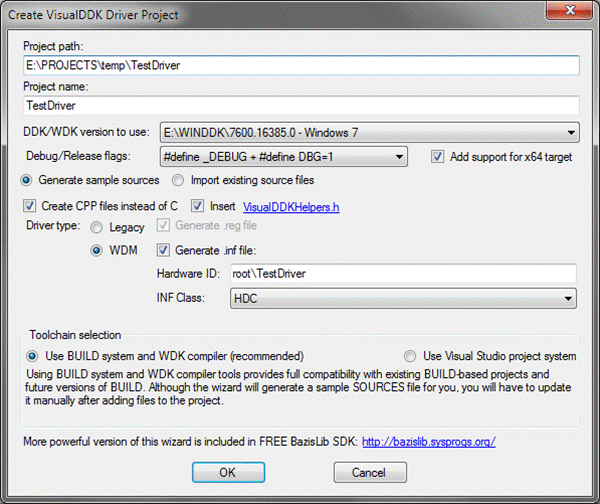
For many years, developing and debugging device drivers for Windows was quite a different process from developing and testing applications. However, the release of the Visual Studio SDK, as well as the WinDbg SDK, made it possible to take the best from both worlds and create a single, free, tool. This tool is VisualDDK (see Figure 1).

Figure 1 - VisualDDK: Windows Drivers in Visual Studio World
The main aims of VisualDDK development are to make both the driver development and debugging experience as close as possible to the well-automated application development experience in Windows. This article describes the features of
VisualDDK and their impact on kernel-mode development using Visual Studio, as well as the implementation details for some "tricky" parts.
Interactive Developing and Building
The advantage of using the Visual Studio IDE over a collection of separate tools is clear to those who have spent any time developing applications: quick error navigation, syntax highlighting and IntelliSense, and various third-party refactoring gizmos. However, just opening a source file in the IDE won't do the magic, as Visual Studio uses the project system to keep all those features integrated. For example, when IntelliSense builds its suggestion database, it needs to know include paths and preprocessor macros in order to produce relevant suggestions. Normally, the same information from the XML .vcproj file is used to determine command options for the compiler and linker, and to feed IntelliSense. Fortunately, the Visual C++ Project Engine supports a special "makefile mode." In this mode all information needed for IntelliSense and for launching the debugger is specified explicitly in the project file, and the commands to build/rebuild/clean the project are specified explicitly instead of being internally generated.
VisualDDK uses this mode to generate "wrapper projects" that seamlessly invoke the BUILD command in the given directory. Some interesting code illustrating how one can easily create a makefile project using a script can be found in the VC\VCWizards\AppWiz\Generic\MakefileProject directory of the Visual Studio installation. However, the easiest way to automate this, naturally used by VisualDDK is to create a COM server implementing the IDTWizard interface and register it with Visual Studio. Then, all relevant properties of a "wrapper project" can be described in a few lines of code (shown in Figure 2).
void SetCommonMakeProperties(VCConfiguration cfg, /* configuration options */)
{
cfg.ConfigurationType = ConfigurationTypes.typeUnknown; //Enable 'make' mode
VCNMakeTool tool = (VCNMakeTool)((IVCCollection)cfg.Tools).Item("VCNMakeTool");
cfg.OutputDirectory = cfg.IntermediateDirectory = DetectBUILDOutputDir(...);
tool.BuildCommandLine = "call $(WDKPATH)\\bin\\setenv.bat $(WDKPATH) " + (DebugConfig ? "chk" : "fre") + " " + ddkInfo.BUILDName + "\r\ncd /d " + baseBuildPath + "\r\nbuild";
tool.IncludeSearchPath = ...
...
}
...
Solution solution = IDEObject.Solution;
solution.Create(Destination, Name);
Project prj = solution.AddFromTemplate(VSBase + @"..\..\VC\VCWizards\default.vcproj", Destination, Name, true);
VCProject vprj = (VCProject)prj.Object;
foreach (VCConfiguration cfg in ((IVCCollection)vprj.Configurations))
{
SetCommonMakeProperties(cfg, ...);
}
Figure 2 - Defining a "Wrapper Project" in VisualDDK
This simple approach is enough to support IntelliSense, building/rebuilding/cleaning, automatic error message parsing and even correct launching (see the Launcher section below). IntelliSense correctly displays suggestions based from both project sources/headers and WDK headers, the "go to definition" function works perfectly, and the integrated help handles WDK functions (assuming their reference is a part of standard help).
However, this approach does have one major drawback: the source file list used by Visual Studio and the sources file used by BUILD are not kept synchronized, requiring the developer to update the latter every time new sources are added to Visual Studio project. Another small issue is that all additional preprocessor macros managed by BUILD need to be synchronized with the project properties in order to keep IntelliSense precision at maximum.
The VisualDDK wizard allows creating new projects based on templates, as well as wrapping around existing BUILD projects. Note that in the last case the Visual Studio project directory can be different from BUILD project directory to keep Visual Studio files separately.
The Debugger
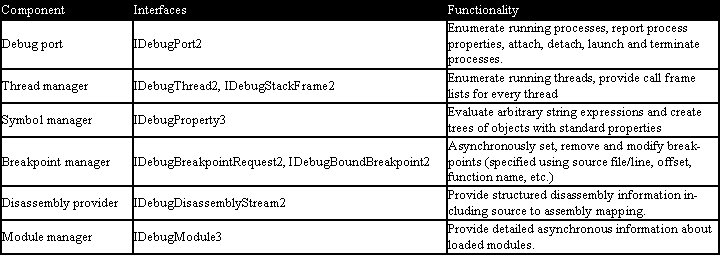
Although the Visual Studio debugging system is quite extensible, the existing native debugging engine seems to be architecturally incompatible with kernel-mode debugging. In addition, the symbol engine used by Visual Studio is an integral part of its debugging engine and cannot be used separately. This means that just telling VS how to read/write target memory, manage CPU context and perform various types of stepping is not enough. A more sophisticated implementation is required. Let's review the main components of such a debug engine and see what functionality Visual Studio expects from each (shown in Figure 3).

Figure 3 - The Visual Studio Debug Engine
Basically, implementing these (and a few more) interfaces and a small registry change allows use of a custom debug engine from the "Attach" dialog box. Launching the project using a debug engine is slightly more complicated, but basically just involves an ordinary GUI extension, capable of invoking several interface methods.
Let's come back to WinDbg. Fortunately, its engine (DBGENG) comes with an SDK providing most of the required functionality (even if it does use completely different interfaces!). However, the real problem is that Visual Studio and DBGENG have incompatible threading models. While Visual Studio sends asynchronous requests and receives asynchronous notifications, DBGENG expects all interaction to be done from a single thread (calling the synchronous IDebugControl::WaitForEvent() method in every time it wants the target to run, and invoking other methods, only when WaitForEvent() returns). While it is possible to request WaitForEvent() to exit by calling IDebugControl:: SetInterrupt() from an arbitrary thread, this does not work instantly and requires the target machine to be stopped.
VisualDDK connects those incompatible entities by separating the code into 3 major parts:
- The MSDbgSessionBase class handles all threading issues, allowing its children to reliably query and manage engine state (running, waiting, etc.) and execute synchronous requests, ensuring that they will be forwarded to DBGENG in the correct time and from a correct thread. This abstracts the threading model implementation from other code.
- A chain of child classes up to MSDbgSessionEx implement a "debugging session", callable from an arbitrary thread, caching various internal information, but basically, providing a reliable free-threaded debug session with an interface similar to original DBGENG.
- All other classes operate Visual Studio interfaces and structures and service its requests using the free-threaded debug session object owned by debug port.
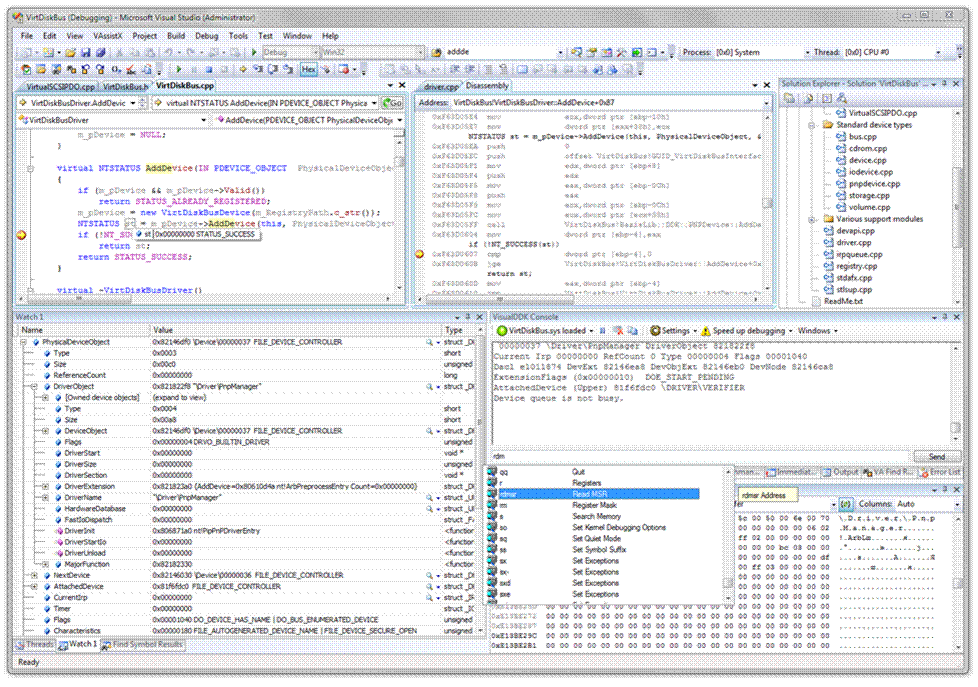
The fact that Visual Studio keeps the port supplier referenced until it shuts down allows you to effectively cache debug sessions and reconnect to debug target instantly. See Figure 4 for a sample debug session with VisualDDK.

Figure 4 - A Sample Debug Session with VisualDDK
That was it for the general architecture of VisualDDK debugging engine. Let's now focus on some special features that improve debugging experience compared to original WinDbg.
Special Features
A common problem that developers have with WinDbg is the extremely long symbol file load time experienced when a symbol server is used. This happens because WinDbg tries to query symbol servers for every PDB that is not present in the local cache, making considerable delays by trying to fetch third-party PDBs over and over at every reload operation. VisualDDK provides a small and elegant solution to this problem:
- By default, it supplies DBGENG with a local-only symbol path without a link to the symbol server. When an unknown module is loaded, VisualDDK temporary enables the symbol server lookup and asks DBGENG to fetch the PDB file.
-
If the PDB for the symbol is not found, its name and timestamp are recorded to the NotDownloadedSymbols.txt file in VisualDDK directory.
-
Next time, when a known symbol is loaded, the symbol servers won't be queried, improving the load time significantly.
Another problem with WinDbg is its extremely slow resolution of unqualified symbols. This is caused by DBGENG trying to go through a list of all loaded symbol names in search for an unqualified name. With around 100K of loaded symbol names this becomes a problem. This is especially true in Visual Studio, which tries to evaluate any piece of code looking like a symbol that gets pointed by mouse cursor (or contained in currently executing line). VisualDDK handles this problem by keeping its internal stdext::hash_map of loaded symbol names. Every time Visual Studio tries to evaluate something like "MySymbol", VisualDDK searches the hash map and converts it into MyModule!MySymbol. The latter is transparently passed to WinDbg engine.
Surprisingly, the implementation of the "Set next statement" feature was easy. This is because every address inside a function that is mapped to a certain source line has the same stack pointer offset related to the current frame. This allows just modifying the instruction pointer to allow jumping to an arbitrary line of code.
Of course, the console WinDbg commands could not be forgotten! A separate GUI extensionwritten in C# displays all output from the DBGENG and allows executing arbitrary commands, including kernel debugger extension DLLs. Additionally, it includes a command suggestion mechanism, that provides quick command reference and can display popup windows with pages from WinDbg manual.
To simplify reading the contents of various NT structures while debugging, VisualDDK contains an extensible expression filter mechanism that will be described later.
A special, but nonetheless relevant case is using virtual machines (VMs) to debug drivers. While being easier to maintain, VMs lack support for the virtual IEEE1394 controller, forcing developers to use the slow pipe-based virtual COM port for debugging. Being non-instantaneous even using minimalistic WinDbg, it could make debugging with Visual Studio intolerably slow. Fortunately, in Windows XP and later, various kernel debugging transports (e.g. UART and FireWire) are implemented in separate interchangeable kernel-mode DLLs. VisualDDK uses this opportunity to provide a custom VM-specific transport DLL, making the debugging connection ~45x faster than using a virtual COM port. For more information, see http://virtualkd.sysprogs.org/.
Automated Driver Launching
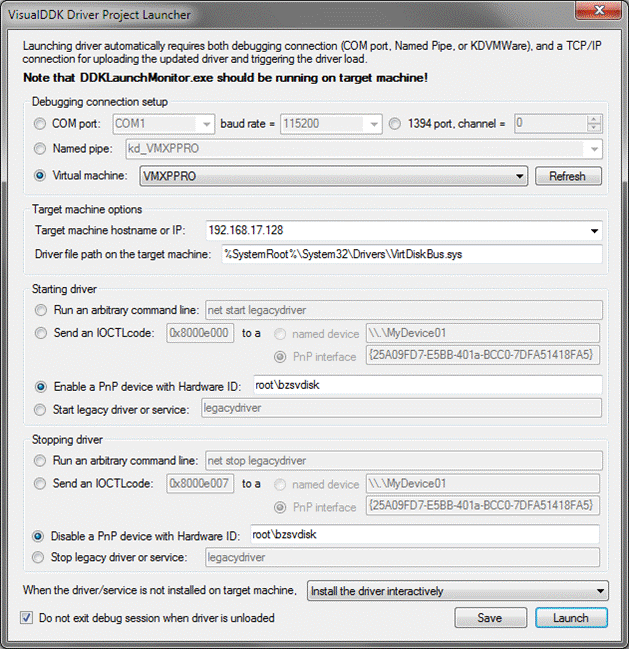
Unfortunately, launching drivers is not as easy as launching user-mode applications. Normally, driver installation and activation are either done manually, or using some custom-made tools. However, Visual Studio's extensible GUI model allowed the creation of a special Driver Launcher, automating the process entirely (See Figure 5). The launcher consists of a host-side GUI extension and a target-side VisualDDK monitor. The connection between them is maintained using the UDP protocol, allowing the host to automatically detect running guests. Let's overview the main commands included in the launcher protocol:
- Transfer a file over TCP and place it on the target.
- Run an arbitrary command line.
- Install, start or stop a legacy service
- Install, enable or disable a PnP device
- Send an arbitrary IOCTL to an arbitrary device
The launcher GUI provides a flexible way to describe the launching process once and to perform it fully automatically later.

Figure 5 - The VisualDDK Driver Project Launcher
Expression Visualizers
One important concern during VisualDDK development was to make all debugging-related information as readable as possible. Obviously, "0x12 DRVO_LEGACY_DRIVER | DRVO_INITIALIZED" has more meaning than just "0x12". As using the standard expression evaluator provided by Visual Studio (and the autoexp.dat feature) was not possible, a similar mechanism had to be developed. To prevent the solution from being overcomplicated, no full-scale scripting engine was developed for this purpose. Instead, the task of visualizing the kernel types was split into two subtasks:
- Annotating flags and enumerations from structure fields (easily scriptable).
- Visualizing other things (e.g. looking up driver and device object names, SCSI_REQUEST_ BLOCK CDBs, etc.)
Thus, one can easily extend the VisualDDK visualization mechanisms to his needs according to these guidelines:
- To modify the field annotation mechanism, open the BasicDDKTypes.dll file in resource editor and locate DDKTYPEINFO object. This is just a text file in a self-descriptive copy-paste-friendly format:
#flags DO_xxx
{
#define DO_VERIFY_VOLUME 0x00000002
//...
}
//...
#enum FILE_DEVICE_xxx
{
#define FILE_DEVICE_BEEP 0x00000001
//...
}
//...
struct _DEVICE_OBJECT {
Flags : DO_xxx;
Characteristics : FILE_CHAR_xxx;
DeviceType : FILE_DEVICE_xxx;
}
//...
By modifying this file, one can easily make VisualDDK annotate any structure fields.
-
To support arbitrary visualization, one should create IDDKPropertyFilter and IDDKPropertyFilterSupplier interfaces. Every time Visual Studio evaluates an expression, VisualDDK queries all filter suppliers for a filter, corresponding to the expression type. Every such filter can do the following things:
-
Arbitrarily change expression name, value and attributes.
-
Insert, delete, or recursively filter any child expressions (such as structure members).
It is even simpler to create a custom filter based on the BasicDDKFilters source code. Here is an example (Figure 6)of the filter that displays object names for handles and invokes "!handle" when the user clicks on "view raw string".
namespace
{
wchar_t wszHandleDumpFormat[] = L"!handle 0x%I64X";
}
class CHandleFilter : public _NTStructureDumpHelper<wszHandleDumpFormat, DBG_ATTRIB_VALUE_RAW_STRING | DBG_ATTRIB_OBJ_IS_EXPANDABLE>
{
public:
enum {FilterFlags = ValueFiltered | RawStringValueFiltered | AttributesFiltered};
virtual HRESULT STDMETHODCALLTYPE FilterValue(IDDKProperty *pProperty, /* ... */ ) override
{
if (RawValue)
return S_FALSE;
*FilteredValue = GetHandleTargetName(pProperty);
return S_OK;
}
};
//...
m_SpecialTypeMap[L"HANDLE"] = MakeFilterInfo<CHandleFilter>();
Figure 6 - Example of a Custom Filter
Presently, VisualDDK comes with visualizers for basic NT structures, STLPort containers and strings, and core objects of BazisLib, an object-oriented framework for creating virtual device drivers and porting functionality between user-mode and kernel-mode.
Summary
There you have it! A new tool is available to the community, free of charge, which can bring many of the conveniences of application development and debugging to kernel-mode driver development. When you get a chance, give VisualDDK a try. See the sidebar below for more info on VisualDDK.
Ivan Shcherbakov is doing his study and research in the field of wireless sensor networks in the Technical University of Kaiserslautern, Germany. In his second life, he maintains the SysProgs.org site containing various free system utilities. Ivan can be contacted via SysProgs forums, or directly via ivan@sysprogs.org.