Easy Once You've Done It -- Setting Up the Debugger
The NT Insider, Vol 11, Issue 3&4, May-August 2004 | Published: 18-Aug-04| Modified: 18-Aug-04
For you experienced folks, setting-up a debugger is something done with your eyes closed. But, for those developers new to debugging, setting-up a debug connection between two machines can be an exercise in frustration. This article provides a walk-through of this process. For this discussion, We will be talking about debugging using WinDBG. If you are using another debugger, please consult its documentation.
Getting Started
The most important thing about setting-up debugging is ensuring connectivity between the host and the target. If they cannot talk to each other, there is no way that you are going to be using the debugger. How you test connectivity depends on what you plan to use as the communication medium between the host and the target.
If you are planning on using the serial port, than we recommend you test the connection between the 2 systems using HyperTerminal. On the host and the target, while in HyperTerminal, select the serial port and baud rate to be used (it works much better if you select the same baud rate on both systems). Once the connection is established, you should be able to type characters on one system (input characters do not get echoed on the local system by default) and see them appear on the other system. Again, if this doesn’t work, don’t expect WinDBG to work.
If you are planning on using IEEE 1394, then my suggestion is boot up both systems with the 1394 cable attached and see if Windows installs a 1394 network adapter on each system. If it does, then you can assign each adapter a fixed IP address (for example 10.1.10.1 and 10.1.10.2), and then attempt to copy a file from one system to another: "copy x.txt \\10.1.10.1\sharename". If this works, then there’s a pretty good chance that WinDBG will be able to talk 1394 between your two systems.
Setting-up Debugging on the Target
Okay, now that you have proven that the 2 systems can talk to each other, you now have to set-up debugging on the target system. It does not matter whether the system is running a free version of the OS, a checked version of the OS, or a "hybrid" version -- (see "Just Checking Revisited", p 9 in this issue), the system must have debugging set up in order for WinDBG to be able connect to it. For x86 and AMD64 based systems, debugging is enabled by modifying the boot configuration file "boot.ini", as seen in Figure 1.
Figure 1 -- Normal Boot.ini File
Boot.ini is located in the root directory of your boot drive ("C:" for example) and is usually a hidden, read-only file. So if you intend to enable debugging, you are going to have to modify these attributes. To enable debugging, you would modify boot.ini by copying the currently existing boot line to a new line, and appending to it the desired communication to be used. Figure 2 illustrates how the boot.ini file would be modified to use either the serial port (Com1) or 1394 (channel 62) for debugging. Notice that we did not modify the existing boot line in the file. Why? Well, boot.ini is a critical file for booting. If there is anything wrong with this file, Windows will not boot. So to play it safe, I always leave the existing boot line, so that we have a boot line to fall back to (if you have multiple lines in your boot.ini file, Windows will prompt you to select the configuration to boot from). Always better to be safe than be sorry.
Figure 2 -- Debug Enabled Boot.ini File
One thing that we should mention before continuing: If you’re going to be using a partially checked build, then you would include the additional options "/Kernel=" and "/HAL=" to the 2 lines that we added.
Setting up the Host to Debug the Target
Once you have set up the target to be debugged, you now need to set up WinDBG on the host machine so that it can debug the target. Assuming that you’ve already installed WinDBG, clicking on the WinDBG icon should bring up the screen shown in Figure 3.
Figure 3 -- WinDBG
As you probably know, WinDBG is a symbolic debugger. It works based on symbol information provided to it by the user. No symbols = no debugging – it’s that simple. So in order to have a meaningful debugging session, you must provide WinDBG with the location of the symbols for your driver and for the operating system. Setting the location of the symbols in WinDBG can be done by selecting the "Symbol File Path…" submenu under the "File" menu and then entering a path or multiple paths (separated by ";"). These paths should point to the symbols for your driver and for the operating system itself.
Getting symbols for your driver is no problem, because when you build it, a ".PDB" file containing the symbols of your driver is generated by the compiler and linker. Once built, you can take the .PDB file and put it in a directory where WinDBG will look for it – in our case, "C:\DEBUG". Locating symbols for the operating system is another matter.
They can either be obtained by downloading them from links off of http://www.microsoft.com/whdc/DevTools/Debugging/default.mspx or WinDBG can be set up to obtain the symbols from a Symbol Server. As you can see in Figure 4, we used the symbol server syntax to download symbols from Microsoft’s Symbol Server (See the WinDBG documentation, or Go Diskless for details on using the Microsoft Symbol Server).
Figure 4 -- Setting the Symbol File Path
Once you set up your symbol file path, the next thing that you need to do is to set up the WinDBG source file path. This path allows the debugger to display your source code in the event that a crash occurs in your driver or in the event that it hits a dynamic breakpoint. The source file path is set by selecting the "Source File Path…" submenu under the "File" menu. The displayed dialog box allows the user to enter a path or multiple paths to source code as seen in Figure 5.
Figure 5 -- Setting the Source File Path
Now that WinDBG knows where our symbols and sources are, we need to tell it what it is going to be debugging. WinDBG is capable of debugging applications, crash dumps, doing remote debugging, and doing kernel debugging. Since we are debugging a kernel driver, we would select the "Kernel Debug…" submenu under the "File" menu. The selection displays the dialog box shown in Figure 6 which allows us to select the method of communication with our target system.
Figure 6 -- Selecting the Debugger Method
Of the three possible options, only the COM and 1394 options are of interest to us. The Local option is a very restricted type of kernel debugging and is not useful for debugging a driver.
When selecting the COM or 1394 option, the user is required to enter in either the IEEE 1394 channel, for 1394 debugging, or the COM port and baud rate for serial port debugging. What you enter depends on how you set up the target. If your target is set up for debugging via the COM port, then you enter the COM port and baud rate that you used on this system when you tested it with HyperTerminal. If your target is set up for IEEE 1394 debugging then you would enter the channel number that you selected on the remote system.
Once you set your kernel debug communication parameters and hit the "OK" button, WinDBG will typically display a message indicating that it is waiting to reconnect (see Figure 7). If the target that you are going to debug is already rebooted in debug mode, then you can force WinDBG to take control of that system by selecting the "Break" submenu under the "Debug" menu. If, however, the target system has not been rebooted in debug mode, you can do so at any time and WinDBG will automatically connect to the target as it boots.
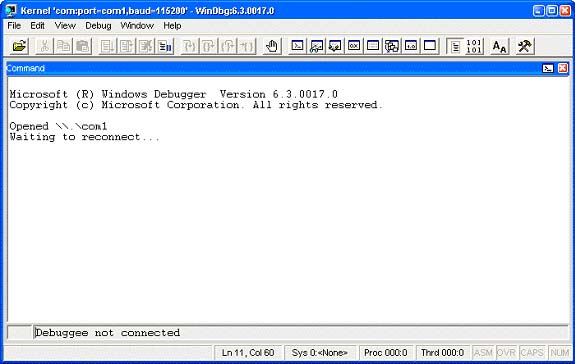
Figure 7 -- WinDBG...Waiting to Connect
Once WinDBG has taken over control of the target, the target is halted until WinDBG releases control. At this point you are going to have to spend some time to learn WinDBG command syntax. Ahhhh….the joys of debugging…
User Comments
Rate this article and give us feedback. Do you find anything missing? Share your opinion with the community!
 Post Your Comment
|
|